The NCover extension for visual studio 2008 and 2010 is a brand new avenue to view the code coverage data collected with NCover v4 Desktop. Here is a quick overview of some of the features you will see in these extensions.
NCover menu
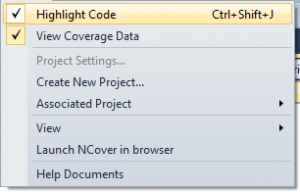
You will find an NCover menu in the main menu bar of Visual Studio. This menu activates whenever a solution is opened, since NCover saves settings on a per-solution basis. Here you can turn code highlighting on/off, turn coverage data lookup on/off (“View Coverage Data”), view NCover project settings or create a new project, and set the associated NCover project for this solution. The associated project menu has an option for “All Projects” that when selected will cause the scope of coverage data lookup to encompass all of your NCover projects. Another way of thinking about this option is “Global Coverage Mode,” if there is coverage data in any of your projects that applies to what you’re viewing in visual studio, it will show up in the extension. If you create a new NCover project from within the extension, you will get the same UI that is available in the NCover web application. When you create a new project, the solution will automatically be associated with that project, and the “Project Settings” option will only be enabled when the solution is associated with a specific NCover project.
The text editor
The NCover extension for visual studio offers tight integration with the text editor. At the top of the text editor you’ll find a notification bar that will provide information about the coverage state of the document you’re viewing. If the document is out of sync with the latest coverage data, you can click the notification bar to view that document in the NCover Source View. The source view will have the coverage synced with the source, since NCover 4 now stores source code along with coverage data.
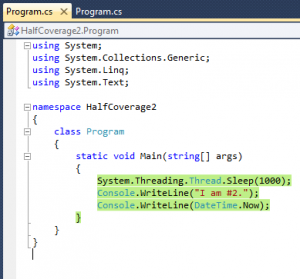
If NCover is able to find coverage data for the document that is open, it will highlight the code in the text editor based on that coverage data. The 2010 extension offers the ability to make edits to the code while still leaving the highlighting intact. Remember, while making edits to a document, you can always view the highlighted source code in it’s original state by viewing the document in the NCover Source view. The text editor, including highlighting, will be updated whenever new coverage data is collected for that project.
NCover context menu
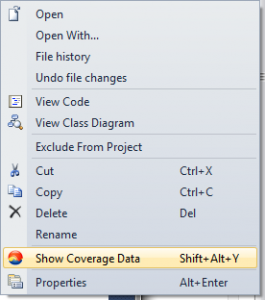
We added a menu option to the right-click context menu in visual studio. This option is applicable when right clicking anywhere inside the text editor, or anywhere inside the solution explorer. When this option is clicked, the extension will open the applicable NCover tool window and show you more information about the coverage data for that particular context. If the extension could not find any coverage data for that context, the “No Coverage” view will be displayed. From the text editor, you can right click in methods, properties, classes, and namespaces, or somewhere outside of those scopes to view document coverage. From the solution explorer, you can select documents, folders, projects or the solution node (this context is only applicable if an NCover project is associated with the solution).
NCover tool windows
The NCover extension has three different tool windows: Explorer View, Source View, and Statistics View. These represent different facets of NCover v4 Desktop that are easy to split up and rearrange within visual studio.
The Explorer View allows you to navigate through different levels of code coverage for the latest execution in the selected coverage context.
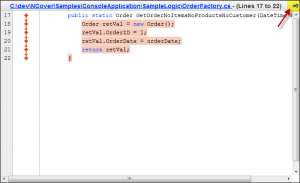
The Source View allows you to view highlighted details on documents or methods at the source code level.
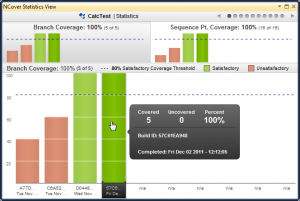
The Statistics View will show the charts and statistics for the current location of the Explorer View. Wherever you navigate in the Explorer View, the Statistics View will be updated with stats for that level of coverage.
Tool window tips
- Try different placements for the tool windows. We separated the functionality offered in the web app to make it easier to show and hide different features.
- If you use the Explorer view to navigate down to the method source level, it will display the method detail in the Source View. This also goes for documents.
- There is a little visual studio icon in the upper right hand corner of the Source View that when clicked will open that document and take you to that spot in the main Visual Studio Text editor.
- When looking at a method in the Source View, you can view the full document in the Source View by clicking the url in the title bar.
- You may wonder why the window says “No Coverage” right after you open it. In the statistics view, this means that the explorer view is not pointing to any coverage data. In the other two views, this either means that the NCover extension could not find any coverage for the context that you requested coverage for, or you have not navigated to any coverage data using the NCover context menu. You must right click a context in visual studio and click “Show Coverage Data” for the tool windows to show any coverage data.
These are the basics to help you get started with the NCover plugin for visual studio 2008 and 2010. We tried to keep it as simple as possible, but not too simple.
