The NCover interface has been designed to give you useful information and statistics at every level of your project. Each page gives you data that can be interacted with and acted upon. Rather than simply providing static reports that are out of date as soon as a new build is available, NCover gives you the ability to explore and dive deep into your code base. Trend graphs are created for all coverage metrics so that you manage your team's progress over time.
Code Coverage
Data Rich Interactive Browser Interface
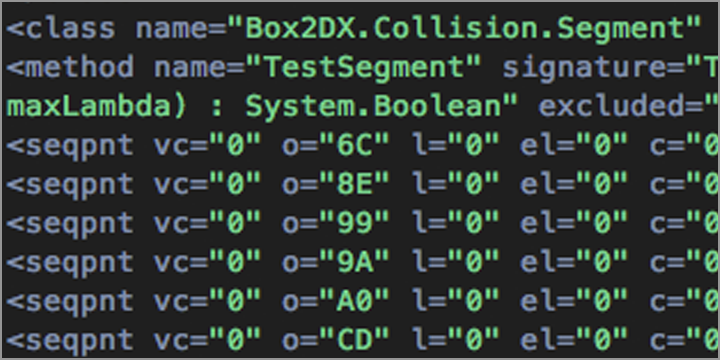
Pre-Instrumentation
NCover Desktop and Code Central provide the option to embed profiling in assemblies, reducing the need for profiling at runtime. This allows assemblies to become portable, reduces overhead at startup and removes potential conflicts with other applications utilizing the profiling API. Pre-instrumentation with NCover provides greater control over how you manage the profiling process and provides an option for collecting coverage in sandboxed environments.
Coverage For Windows Store Apps
NCover enables the collection of coverage data on Windows Store Apps through the use of pre-instrumentation. By embedding profiling into the assembly, NCover allows you to collect full coverage data, including advanced coverage metrics like Condition Coverage, Change Risk Anti-Patterns and Branch Coverage, for Windows Store Apps and Windows RT apps without the limitation of collecting coverage in debug mode.
Baseline Executions
Experienced development and QA teams know that code coverage is as much about the journey as the destination. NCover makes it easier than ever to track your progress on that journey with Baseline Executions. Mark up to three individual executions or merged executions as a Baseline Execution and track your progress against them. Whether you mark the end of a release cycle or compare current development to previously released products, you will always know how the health of your code has changed over time.
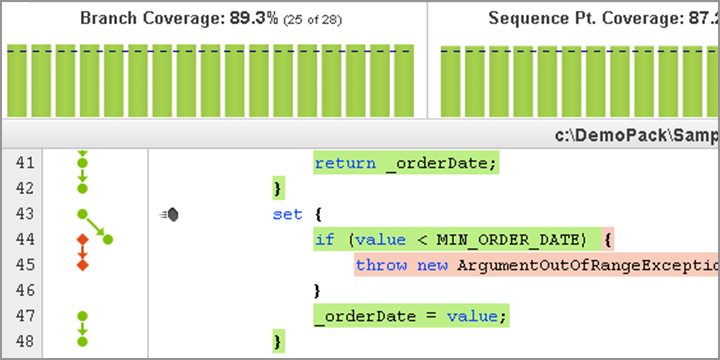
Condition Coverage
NCover provides enhanced insight into .NET code coverage with the addition of Condition Coverage as an advanced code coverage metric. Condition Coverage provides empirical data covering the connections between code branches. With Condition Coverage, each condition leading to a particular branch is tracked and reported as covered or uncovered using this new metric. This metric enhances Branch Coverage Visualization and provides more in-depth feedback for coverage of loops and switch statements.
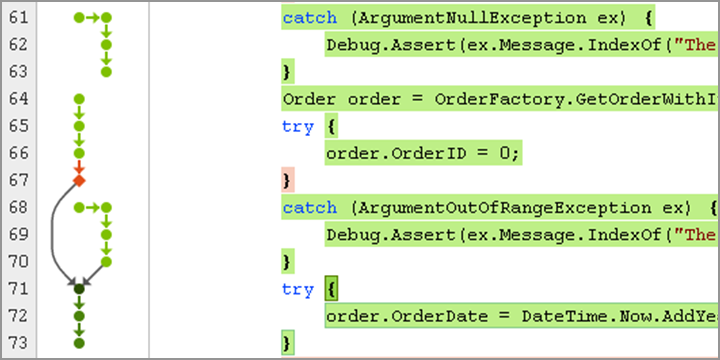
Branch Coverage Visualization
Branch coverage visualization is a graphical display of the possible paths through the code you are profiling. Simply roll over the branch visualization markers for a real time view of the flow of your code and its corresponding coverage. This view allows you to see how you can simplify, optimize, and understand your code. Branch coverage visualization uses the familiar red and green color scheme to identify which code has been tested. The result is that untested code stands out, allowing you to focus on the areas of code where additional development effort is required.
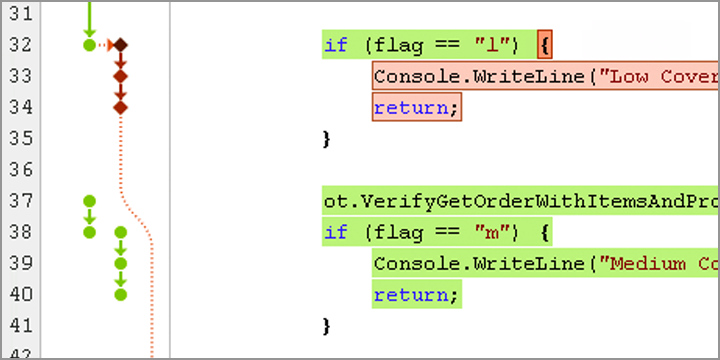
Source Code Syntax Highlighting
NCover accurately identifies individual lines of code that have not been tested. Lines of code that are highlighted in green have been tested, while lines in red have not. With NCover you can start analyzing code at the source level or you can use NCover's powerful and easy to understand dashboard to find trouble errors at the high level and quickly drill down to specific trouble areas. This simple, powerful tool helps developers see exactly where they need to focus their efforts.
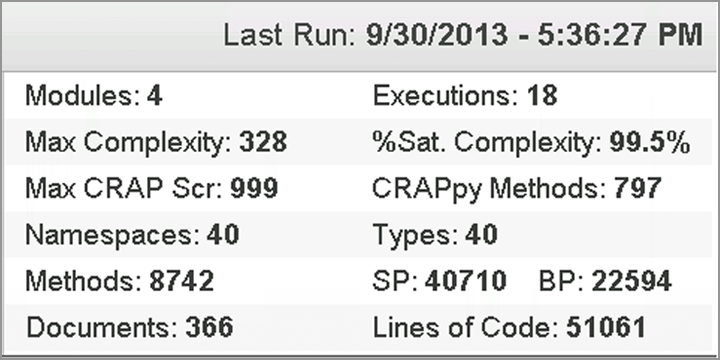
Standard Source Code Analytics
NCover provides a broad spectrum of standard source code analytics including Modules, Max Complexity, Namespaces, Methods, Documents, Executions, Percentage Satisfactory Complexity, Types, Sequence Points, Branch Points and Lines of Code. This wealth of information is displayed in an easy to use interface that is easy to access and easy to use, providing you a great baseline for managing your code.
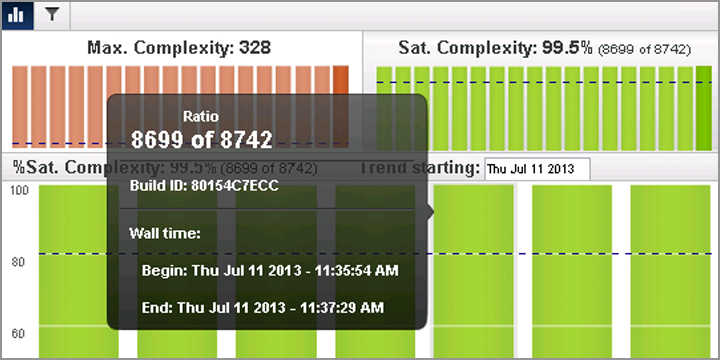
Cyclomatic Complexity
NCover provides you with more than just standard source code analytics. Cyclomatic complexity is a software metric that lets you measure the complexity of your applications. By measuring the number of linearly independent paths that exist in your source code, NCover shows you where your code has opportunities for simplification. This is crucial for development organizations because modules with the highest complexity also tend to have the most defects. If you are able to reduce code complexity, you can reduce bugs and can also reduce the cost of maintaining that code.
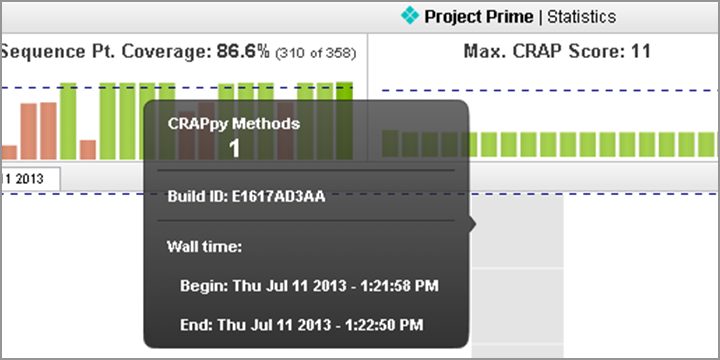
Change Risk Anti-Patterns (CRAP)
Metrics like the Change Risk Anti-Patterns (CRAP) score are a better measure of risk than coverage alone. Since it is extremely difficult to get to full coverage, CRAP score weighs the amount of uncovered code against the complexity of that code. Code that is more complex typically needs more complete coverage because the increase in complexity increases the mathematical likelihood for errors. CRAP score finds methods that are least covered for a given level of complexity.
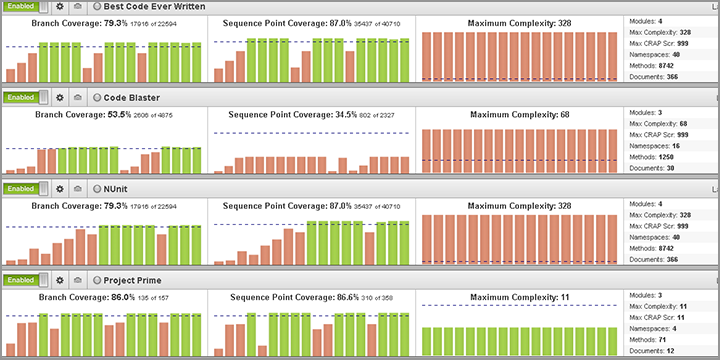
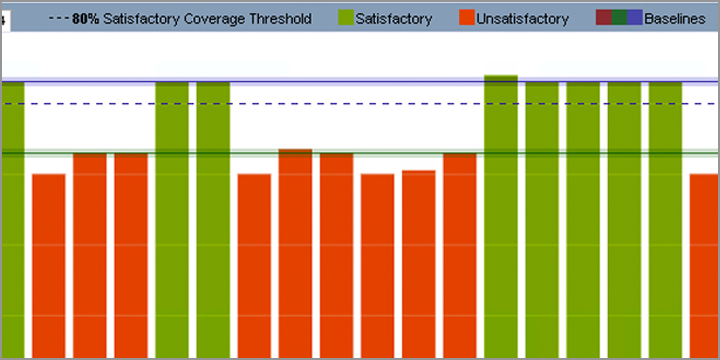
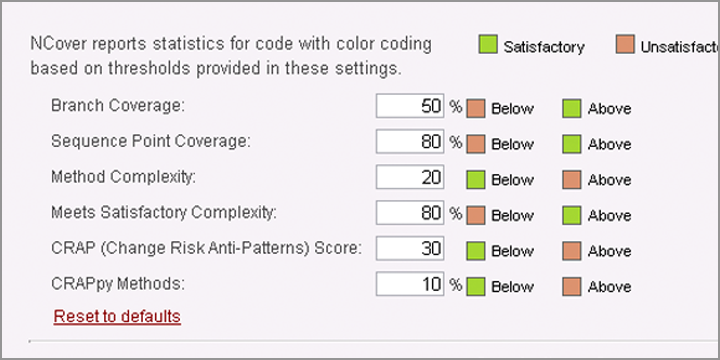
Set Coverage Thresholds
Set satisfactory thresholds for a project and track your team's progress as they work to meet the goals you have set. When your team has met or exceeded a threshold, the bar in the graph will turn green. When your team is below a set threshold, the bar will turn red. At a glance, you will be able to quickly measure which portions of code meet the standards you have set with your team and which require attention.
Fail Builds Based on Satisfactory Thresholds
Once you have established the satisfactory thresholds that are right for you and your team, you can also make your build fail when testing does not meet the desired coverage thresholds. This saves your team the time and energy normally associates with having to deal with excessively buggy code after it has been released to QA. NCover generates fail codes that are recognized by most major build tools, allowing your code coverage process and your build process to work together.
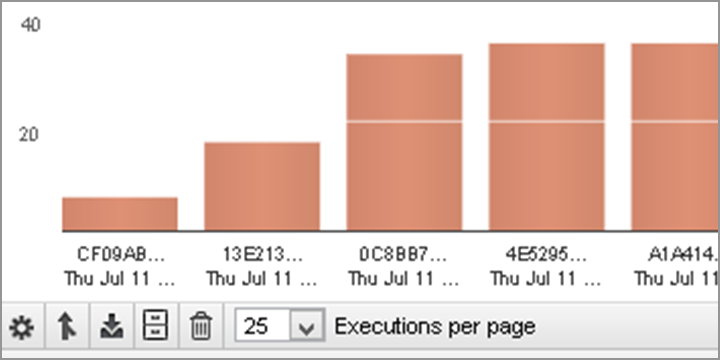
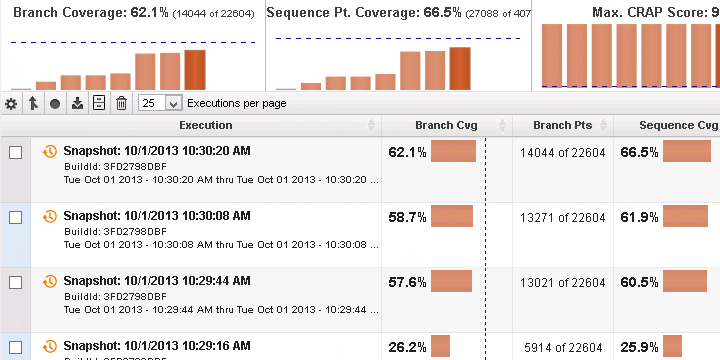
Snapshots of Ongoing Coverage
The NCover snapshot feature is useful for monitoring the progress of long-running executions. When you take a snapshot, you can get an up to the minute view of the coverage data being created without pausing or interfering with the ongoing collection of coverage data. Once the snapshot is complete, drill down to the executions view to see the results.
Portable Coverage Data Export (JSON, XML)
In addition to providing a rich graphical interface, NCover also provides the ability to export your coverage data. NCover supports exporting JSON and XML coverage data with the ability to manage what is included in the export. This is useful for archiving progress and maintaining a historical record, or for uploading data to an existing compatible reporting tool.