NCover Code Central seamlessly pulls together your coverage data from any of the NCover products used by your team. Managers are able to see project overviews at-a-glance, monitor team-wide trends, and drill down into the details when needed. With just a few clicks, managers can set thresholds to ensure that your team is testing effectively and writing quality code. Developers and QA members can log-in from their desktops and view, not only how they are doing, but how their entire team is trending. This helps teams stay transparent and on task.
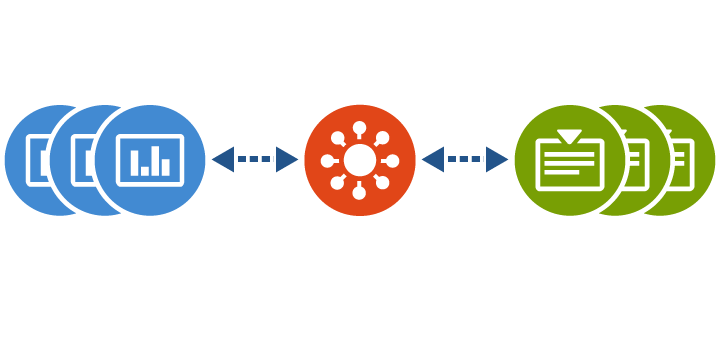
.NET Code Coverage Comes Together
Collect coverage data from multiple locations and individuals
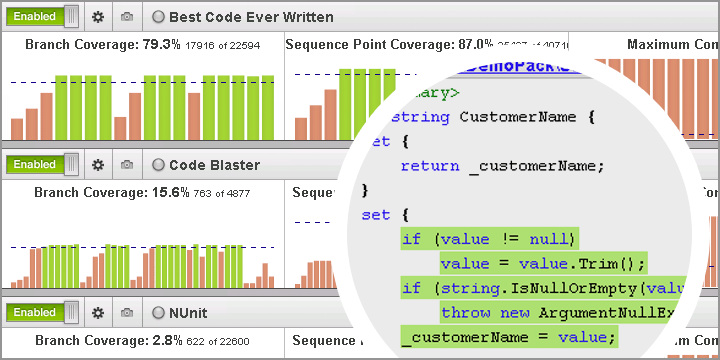
Get the big picture and the small details
View coverage trends or dive deep into individual lines of code
The NCover project overview page brings your coverage data for all of your code coverage projects into a centralized location. Whether you are an individual developer, a member of a development team, a team lead or a manager, you can quickly access up-to-date information about your code's health and take action where necessary. In addition, the ability to easily manage multiple projects and consolidate execution runs gives you control over the level of system resources required to effectively manage your code base.
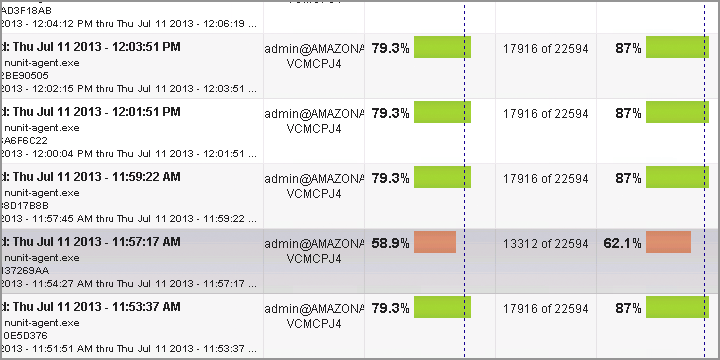
Find actionable metrics in the quickest time possible
Identify issues and focus on the highest priority areas
Whether you are viewing the meticulously designed projects overview page, the trend graph, or the easy to understand branch visualization, NCover Code Central is designed to help you understand and take action on your company's code coverage data. Quickly spot build quality issues with the multicolored trend graph. Use branch visualization to pinpoint the exact line of code that is unnecessarily complicating your code. Search your source code from every build to every method, making sure every line is up to your team's standards.