Using Thresholds To Manage Code Coverage Levels
With NCover, it is easy to setup coverage thresholds to help you maintain the quality standards established for your .NET code base.
With the use of thresholds, NCover makes it easy to achieve and maintain quality standards across your entire code base. Setting thresholds is important to monitoring the health of your code and is critical in team-based environments where applying consistent standards across an entire code base is key to the success of a project.
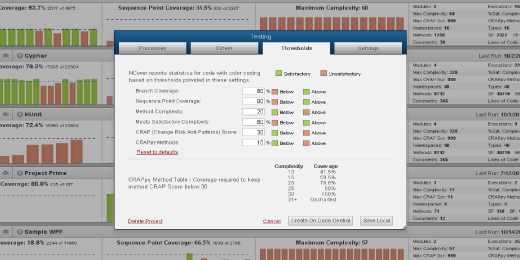
To access Thresholds, click on the Edit Project Settings button for your project, and then click on the Thresholds tab. Each of the coverage metrics tracked by NCover is initially set to a default threshold value. Adjustments to these values will apply to all historical and future executions profiled by NCover.
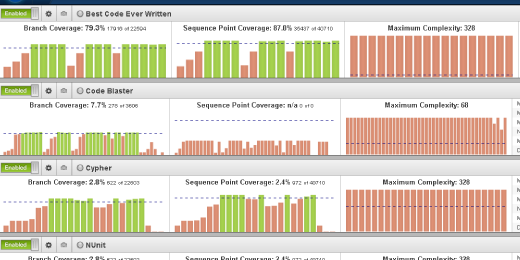
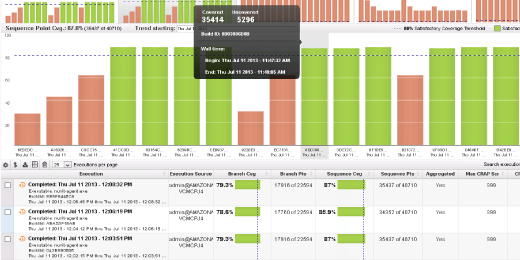
Threshold values are not permanent and can be changed over the course of a project in an effort to improve the quality of your code over time. The threshold values you establish determine the baseline for each coverage metric and are reflected on the dashboard with a horizontal dashed line. Executions that meet or exceed the threshold value are considered satisfactory and represented in green. Unsatisfactory coverage levels are represented in red.
In projects with very large code bases, this method allows both individual contributors and managers to quickly identify trouble areas early in the development process and use NCover as a proactive tool for guiding development and QA efforts. In addition to standard coverage metrics, NCover also provides the Change Risk Anti-Patterns Score, a measure of the complexity of your code. By measuring the complexity of your code, and how that complexity changes over time, you will be better able to determine the need for either increasing or decreasing general coverage thresholds required to maintain a healthy code base.
Videos (VIEW ALL VIDEOS)Instructional Videos Relating to the Use of NCover