Coverage Navigator
At every level below the Home view, the bottom panel of the Code Central window displays the Coverage Navigator. This panel defaults to displaying 10 executions per page, but the drop-down in the Navigator header are allows you to choose as many as 500.
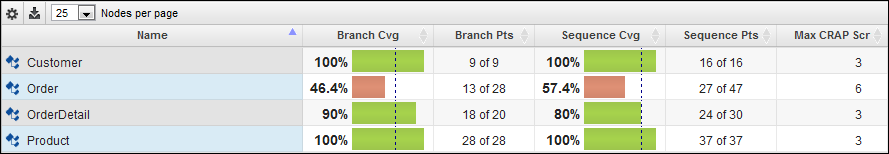
At data levels below the execution, the Coverage Navigator also defaults to displaying 25 nodes per page, but the drop-down allows you to choose up to 500.
Note: The executions page in Code Central will allow you to browse all your executions, but only the most recent 25 are used for trending -- that is, will appear in the Coverage Navigator charts.

Coverage Navigator Menu
Note: The selections below are available at the Execution level only. At the Module level and below, only the relevant options are displayed -- Settings, Export and Nodes per page.
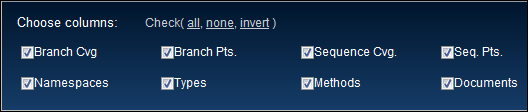
Choose Columns
You can choose which code coverage columns are displayed in the Coverage Navigator by clicking  in the upper-left corner of the panel.
Export - Exports the coverage statistics data in the selected executions to a webpage in comma-delimted format. Don't confuse this export with the command-line export coverage data file functionality.
Search executions - Refine your view by searching on specific criteria like name, build ID, day or date.

Once a filter is applied, a dialog box in the lower left corner of Explorer shows you how many entries are being displayed by the filter in relation to the (unfiltered) total number of executions.

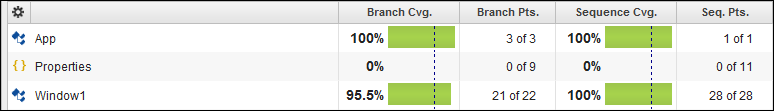
In the bottom panel, the Coverage Navigator also shows you what level of coverage you're viewing, along with the Execution Source, what specific Modules, Documents, Namespaces, Assemblies or Methods are currently loaded Besides your location, the Navigator also displays a customizable summary of all available code coverage metrics on each line.