Migrating From NCover 3
Installation
Then
NCover 3 was installed from the NCover downloads page via a Windows installer, in 32 and 64 bit versions. NCover 3x could be run from the NCover Explorer, a GUI interface which allowed you to generate and view code coverage information using a visual hierarchy. All the same functionality was also available in a command line format using NCover Console. The NCover install also included NCover Reporting, which was accessed either from the Explorer menu, or by using the command line. Reporting, which was integrated into the Explorer, allowed command line access for generating a variety of reports from available coverage files, as well as merging coverage data.
Now
NCover Desktop installs as a Windows service which sets global environment variables that allow it to access the Microsoft profiling environment, then runs in the background, ready to cover any .NET applications or services on your desktop or virtual machine. Both 32 and 64 bit versions are installed and managed automatically, so there's no need to choose which version you need and install them separately. As in previous versions, NCover Desktop can cover managed code running in a .NET environment of 2.5 and above.
Registration
Then
NCover 3 was registered using the Registration GUI, from the command line, or by using a license file, if the machine where NCover 3 was installed didn't have a connection to the internet.
Now
Registering NCover Desktop
After Desktop is installed, logging in to the application for the first time will display the registration screen.
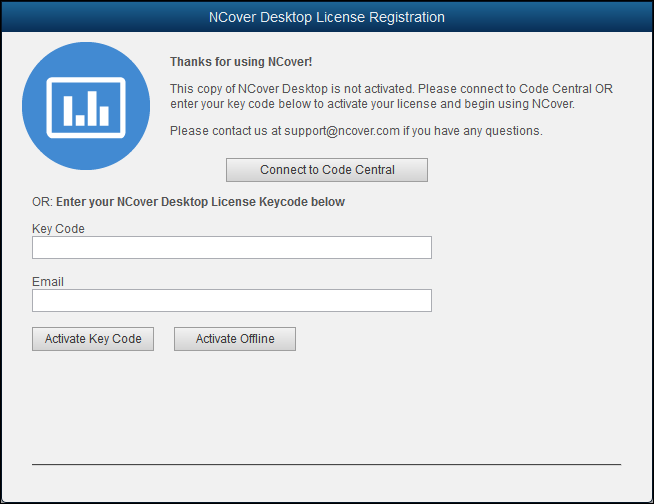
You have two registration options: connect to Code Central, or enter your key code and begin using the standalone Desktop.
Connecting to the Code Central Server
Since Desktop can send coverage data and create projects on Code Central, you're prompted to connect to the Code Central server at registration.
You can connect Desktop to Code Central anytime, as well:
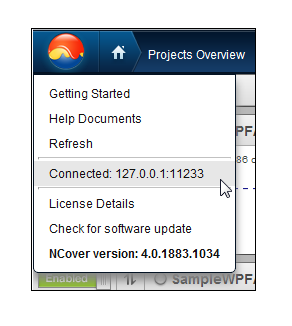
From the NCover menu icon, Click Connect to Code Central Server.
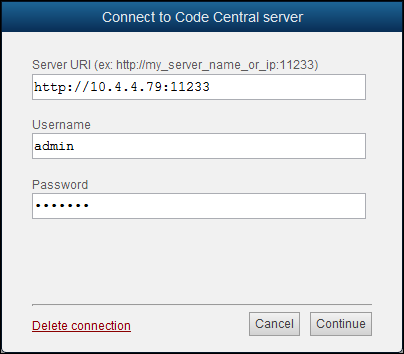
Server URI -- Enter the address of the local host and the port for the Code Central server. This defaults to 127.0.0.1:11233 at installation, but will connect to whatver IP you specify for Code Central.
Username - A valid username as entered in the Admin section of Code Central.
Password - A valid password for the username entered above.
Click on Login and Activate and Desktop will contact the Code Central server. If the connection info you entered is valid and the Code Central service is running, a success message will display.
The NCover menu shows you that Desktop is connected to Code Central.
Registering Standalone Desktop
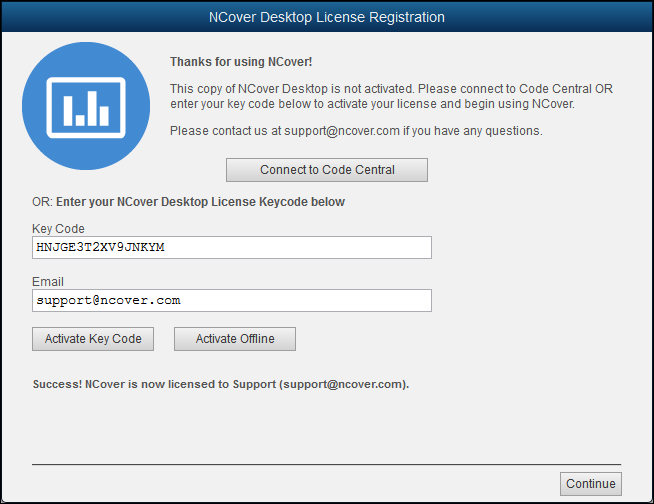
The other option for Desktop at registration is to enter your trial key code and begin using the standalone application.
Key code - Enter the license key code from your purchase order or invoice.
Email - Enter a valid e-mail address.
Click on Activate Key Code and Desktop will contact the NCover license server. If the key you entered is valid and active, a success message will display.
Now you're ready to create a project and start collecting coverage!
Covering a Console Application/Manual Testing
Then
In NCover 3, covering a Windows console or WPF application meant browsing to the executable in NCover Explorer or specifying the path in NCover Console. Once NCover had the correct path, running coverage allowed NCover to start the application and then profile the source code.
Now
Covering an Application/Manual Testing
NCover Desktop runs as a service, so it's already monitoring, ready to cover any .NET code executing on your machine.
This ability to gather data globally is key to understanding how to leverage the power of NCover Desktop. When starting any project the first question you should ask is, What process do I want to cover? If Desktop can find the executable or service that's exercising your code, it can collect coverage data.
Creating a Project
From the Home view of the NCover Desktop, click  to open the "Create a New Project" window.
Match Rules
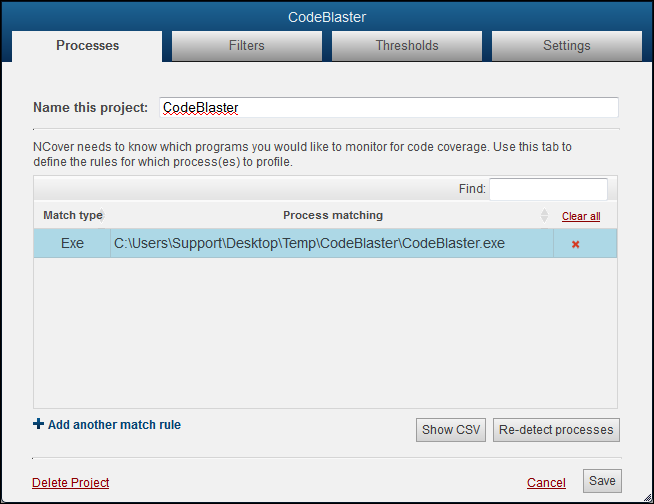
When the "Processes" tab displays, name your project and then select one of two methods to specify the processes to be covered.
Note: If you're setting up coverage for a process running locally on the machine where Code Central is installed, you can let Auto-Configure create project settings for you (see step 3 below).
You can also set up match rules manually, if you prefer.
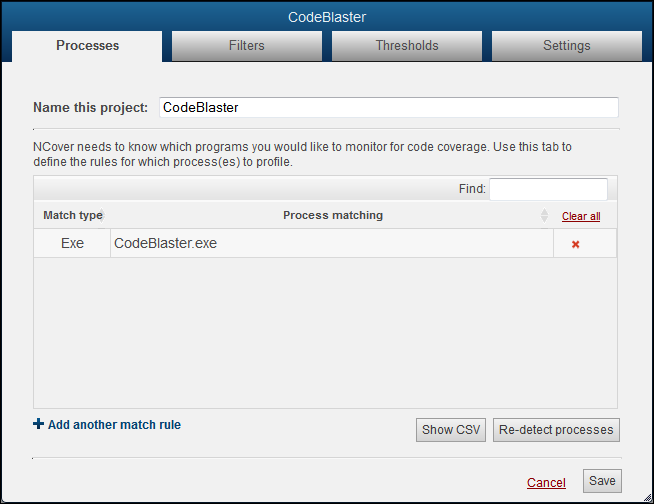
The two match type options are Regex and Exe.
Let's say you want to monitor the NCover code coverage game, Code Blaster. Regex is a good choice in this case. The Regex option would be simply "CodeBlaster", or "codeblaster" -- the regex isn't case-sensitive.
The Exe option tells the NCover profiler to match on the executable name.
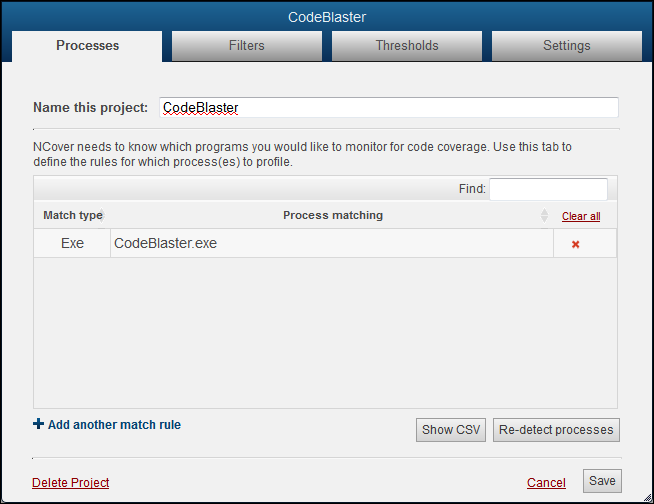
You can also use a file path if you want to profile a process only when it runs from a specific location.
Auto-Configure
You can click on the Auto-Configure button and let NCover create project settings for you.
The Processes tab will switch to the Auto-Detection view and start monitoring for .NET processes as soon as you click on Auto-Configure.
Start the CodeBlaster application, and the executables and assemblies that are being loaded will display in the detection window.
Note: If the process you want to profile is already running, you must re-start it in order for NCover to detect it.
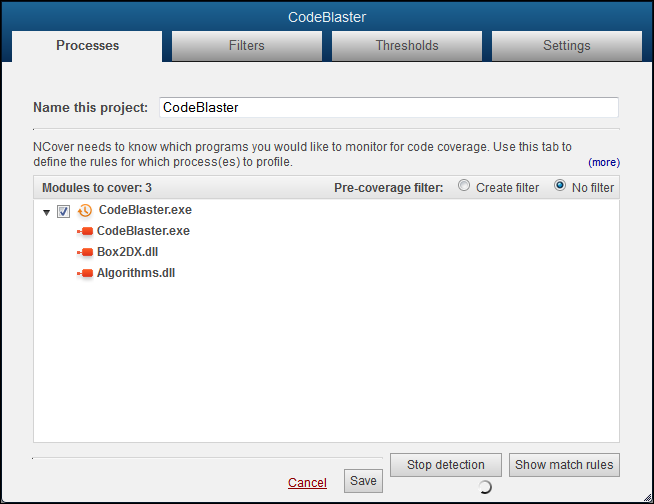
Note: All modules are automatically included when the default "No filter" option is selected.
Switch the Pre-Coverage filter radio button to "Create filter" to review the "Modules to cover" and decide whether to include or exclude modules from the list.
Click the checkbox beside each module once to mark with an X to exclude the module. Click twice to mark with a check to include the module.
Note: You can specifically exclude modules by placing an X beside them on this screen, but any modules that are not specifically included will not be profiled, anyway. In other words, not creating an include is functionally the same as creating an exclude rule.
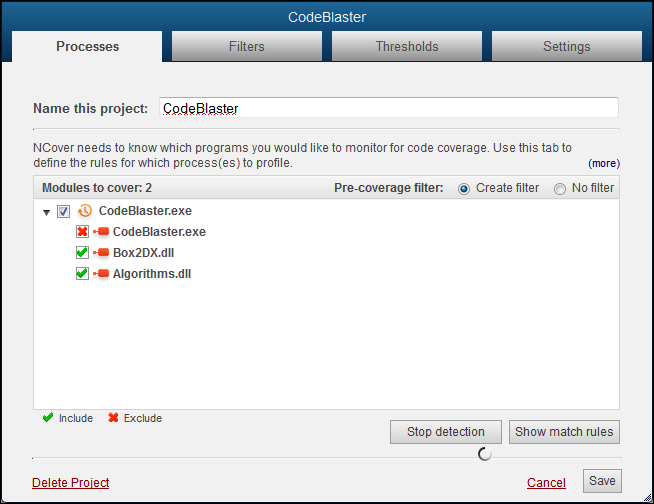
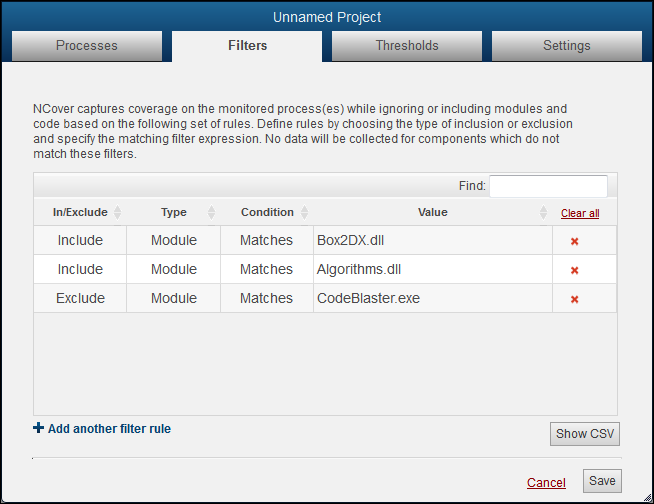
The selections shown above create the filter rules seen below when you click on the Filters tab.
Go the "Processes" tab and click Save to accept these selections, or Re-detect processes to start over.
Collecting Coverage
When your project selections are complete, re-start your application and run your manual tests. Go to the Home page and you'll see that the light beside your enabled project is pulsing green to indicate coverage is being collected.

Immediately to the right of your project name, the Modules Collecting counter displays the number of modules being profiled in the current execution of your project. The number will flRightuctuate while coverage is running, but the counter should eventually disappear when profiling is complete.
When testing is complete, close your tested application and NCover will automatically start compiling the coverage data.
Now that you have coverage data, what does the data mean?
NCover Reports: From 3.x to NCover Desktop
Then
In NCover 3, NCover Explorer or the NCover Reporting command line generated static HTML or XML and output to a path specified in the Explorer or from the command line.
Now
NCover can now produce a self-contained HTML report to summarize an execution. This Coverage Summary report shows the coverage results of the most recent execution by default or an execution specified by the user.
As a self-contained report, this file can be kept as a build artifact, shared via email or as a static web page.
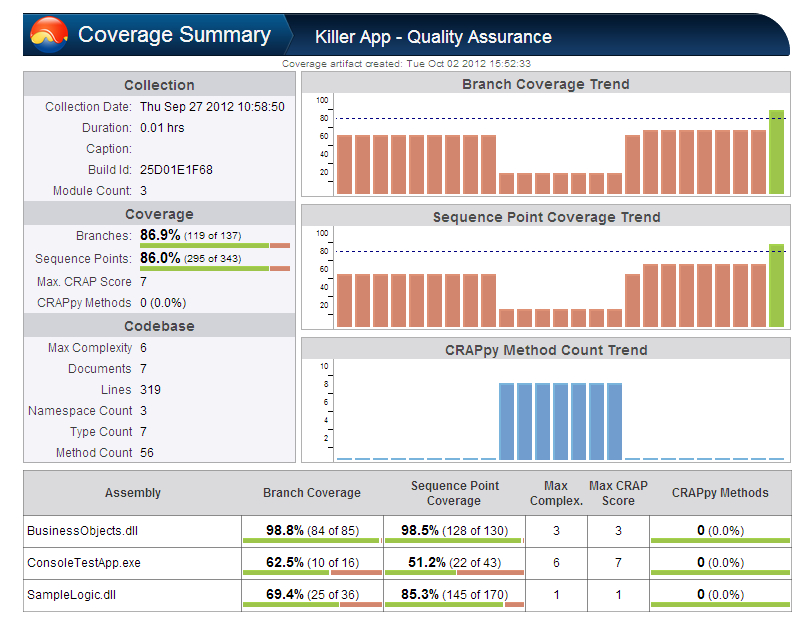
The Coverage Summary report can be generated from Code Central and from Desktop. Please note that Desktop does not server external pages, so the links in a report from Desktop will all point back to loal host (127.0.0.1).
When generated from Code Central, the Coverage Summary has hyperlinks back to the live coverage results within Code Central. These data views can be seen by anyone who can access the Code Central server and has an valid CC login.
Syntax
NCover.exe report --project="MyProject" --execution="MyTestCoverage" --file="MyCoverageReport"
Options
  --project=VALUE        NCover project name.  *REQUIRED*
  --execution=VALUE      Specify execution by Caption, Build Id, or Date.
  --file=VALUE           File name for export.
  --timeout=VALUE        Timeout request after number of seconds
Analyzing Coverage Data
Then
The NCover Explorer provided a graphical way to examine coverage results from a tree view and a source code window. You could set project options, merge files and generate reports from the Explorer, as well.
Now
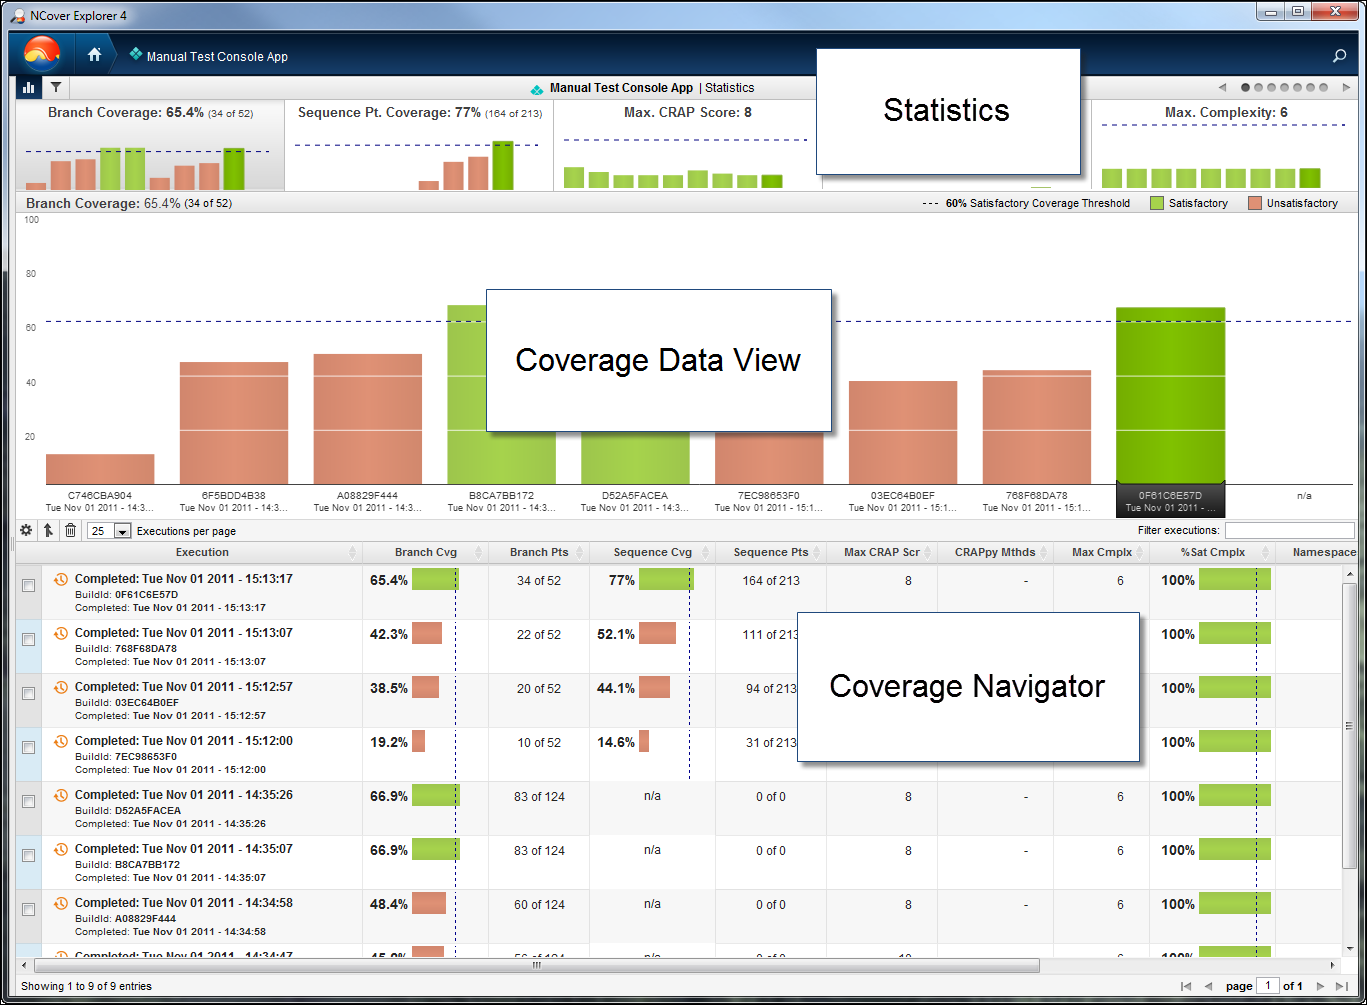
With NCover Desktop, your coverage data is always in front of you. The Data Coverage View changes dynamically to display the data that's relevant to the level of code you're viewing.
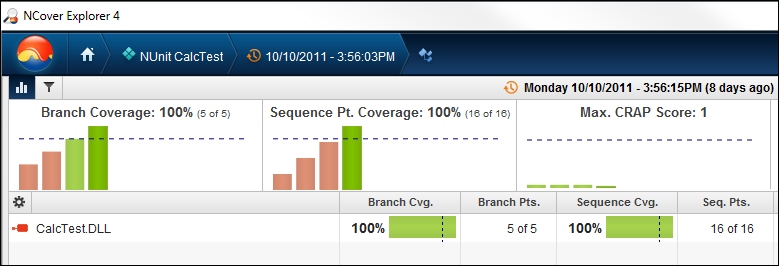
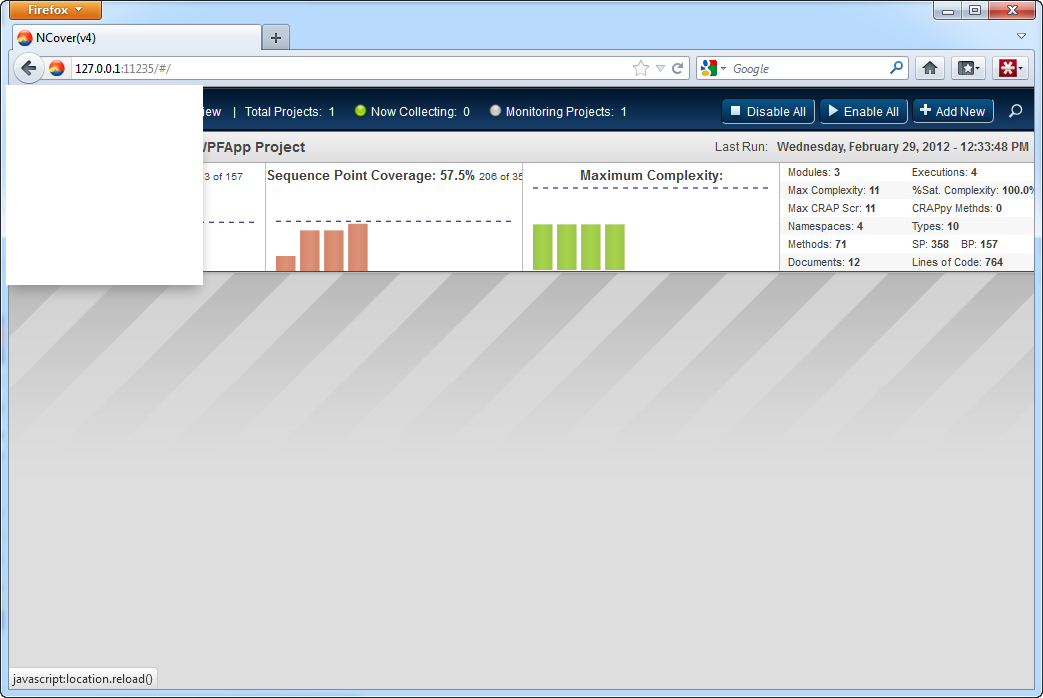
The Home view summarizes all your projects, and the Coverage Data view changes as you drill-down to display statistics at each of six data levels: Execution, Module/Document, Namespace, Assembly, Method, and Source Code.
Once an execution is complete, clicking on the name of your project from the Home page will change to the Project View, with a slider-driven list of Statistics at the top, the Branch Coverage or last selected report in the Coverage Data View, and a list of completed Executions, their logs, and statistical summaries at the bottom, in the Coverage Navigator pane.
Coverage Metrics
Then
NCover 3 gathered Symbol, Branch, Method and Cyclomatic Complexity coverage.
Now
NCover Desktop generates coverage data when an execution is completed successfully. Using the Visual Studio plug-in, this coverage data can be viewed in a variety of ways, detailed in the Viewing Coverage Data section.
NCover helps you make sense of your coverage data by providing statistics at the source code level like Sequence, Branch and Method, and the high-level view of Change Risk Anti-Patterns, and Complexity.
More About CRAP
Metrics like the Change Risk Anti-Patterns (CRAP) score are a better measure of risk than coverage alone. Since it's extremely difficult to get to full coverage, CRAP score weighs the amount of uncovered code against the complexity of that code. Code that is more complex typically needs more complete coverage, because the more complex it is, the more likely it is to have errors. CRAP score finds methods that are least covered for a given level of complexity.
The following metrics will help you get the most out of the data NCover provides, especially when used in conjunction with their customizable thresholds (see Thresholds for details):
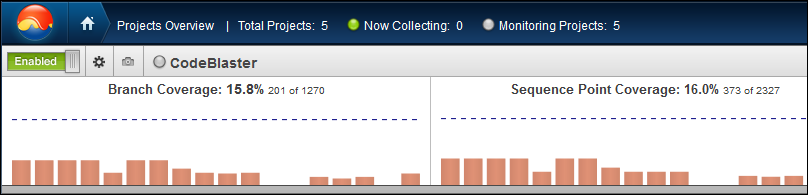
Branch Coverage -- The percentage of individual branch points covered in the testing of the selected execution.
Sequence Point Coverage -- The percentage of sequence points (break points) covered in the testing of the selected execution. The most granular level of coverage, Sequence Point gives a very detailed view of which code has been executed and which code has not.
Max CRAP Score -- The highest Change Risk Analysis and Predictions (CRAP) number in the selected execution. Max CRAP score helps you identify at a glance the most complicated, and risky, parts of the code.
CRAPpy Methods -- Which methods have the highest Change Risk Analysis and Predictions (CRAP) numbers in the selected execution. Max CRAP score helps you identify at a glance the most complicated, and risky, parts of the code.
Max Complexity -- A method's complexity is measured by the number of linearly independent paths from the start of the method to an exit point. In general, the more complex a method is, the harder it is to test or maintain, and the more likely it is to contain bugs or implementation errors.
(Meets) Satisfactory Complexity -- Find out if the complexity of your methods, as defined above, exceeds a user-defined threshold.
Method Count -- The number of methods in the selected execution.
Namespace Count -- The number of globally unique types in the selected execution.
Type Count -- The number of data classifications in the selected execution.
Document Count -- The number of Visual Studio source documents in the selected execution.
Lines of Code -- The number of source code lines in the selected execution.
Navigation
Then
NCover 3 navigation was primarily via the tree view, the source code window and various menus of the Explorer interface.
Now
NCover Desktop offers several more intuitive ways to manage, view and drill-through your coverage data.
The "breadcrumb" hierarchy at the top of the Desktop shows where you are in the coverage data -- by Project, Execution, Module/Document, Namespace, and Method -- and allows you to easily move back up as many levels as you like.

In the bottom panel, the Coverage Navigator also shows you what level of coverage you're viewing, along with what specific Modules, Documents, Namespaces, Assemblies or Methods are currently loaded Besides your location, the Navigator also displays a customizable summary of all available code coverage metrics on each line.
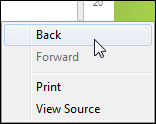
You can go Back or Forward to previously viewed pages by right-clicking anywhere in the Desktop window.
Column Display
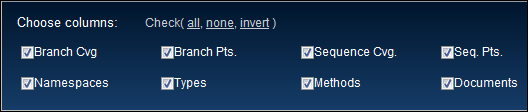
You can choose which code coverage columns are displayed in the Coverage Navigator by clicking  in the upper-left corner of the panel.
Drilling Through Data
After selecting a Project on the Home page, click on an Execution to drill down to the next view, which defaults to Modules, with Documents also available.
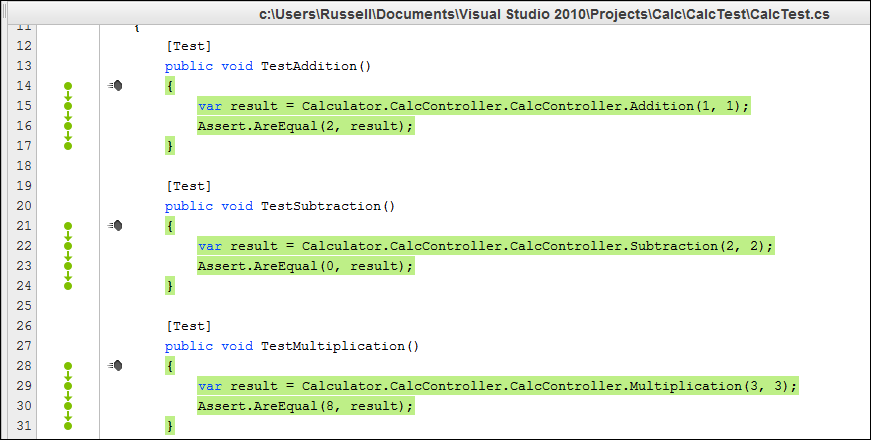
Click on a Module to continue drilling through Namespace, Assembly, and Method to arrive at the Source Code view, where Covered and Visit Counts are displayed in a pop-up when hovering, along with Branch Visualization and coverage highlighting.
In the lower right corner of the Source Code window, the coverage status is indicated by simple red or green text coloring of the word "Covered" in a pop-up window, activated by mousing over lines of code.
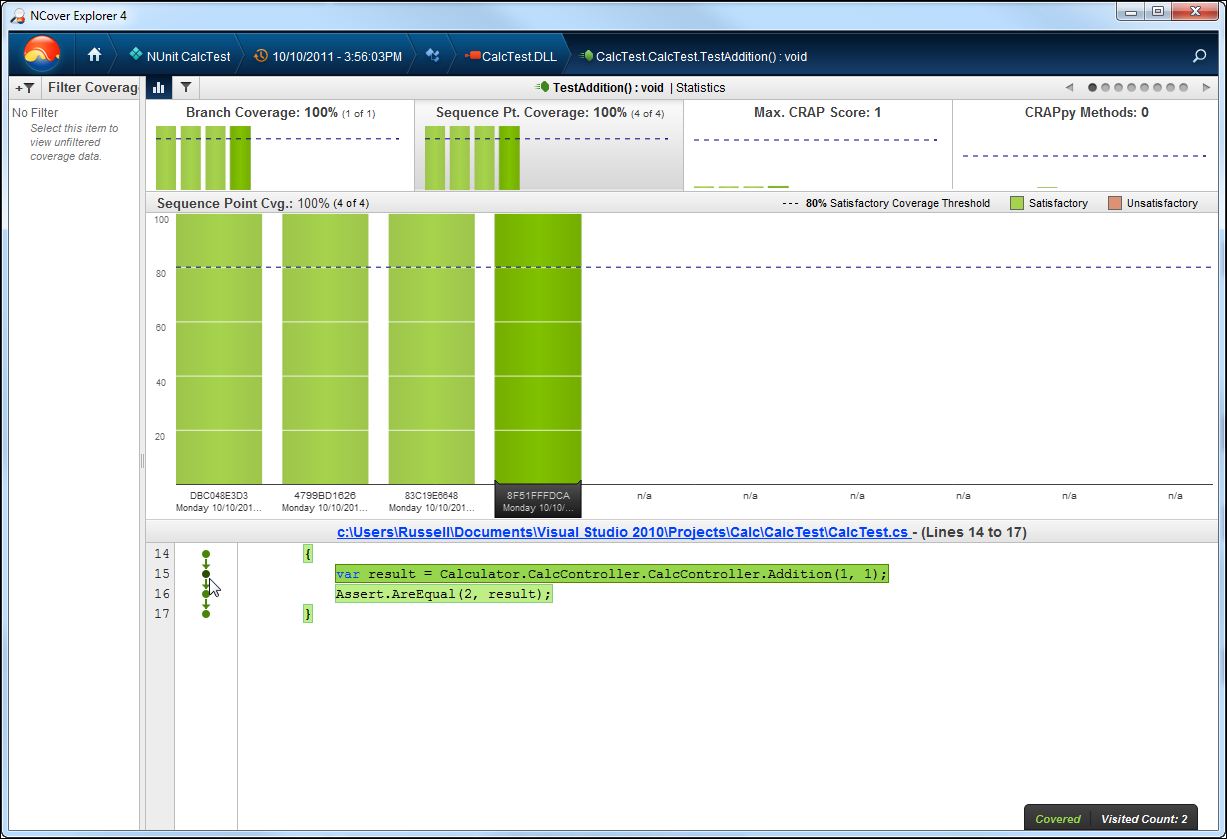
The number of Visit Counts is also displayed in this pop-up when hovering.
Branch Visualization, a graphical display of the possible paths through the highlighted code, is displayed to the left of the source code, and coverage highlighting appears on the code itself.
Clicking on the document link in the Source Code View will display the entire document, rather than the lines of code contained in the method you drilled-down on.
You can refresh your coverage data anytime from the drop-down menu below the NCover icon on the Home view.
NCover Desktop will also alert you with a toast pop-up notification at the top of the Desktop browser window when new coverage data is available.

Understanding Statistics
Then
The NCover 3 Explorer displayed statistics in the tree view based on selections from the Data Viewing tab.
Now
At the Project View and below, the Statistics view in the top panel of the Desktop window displays data relevant to the selected Execution.
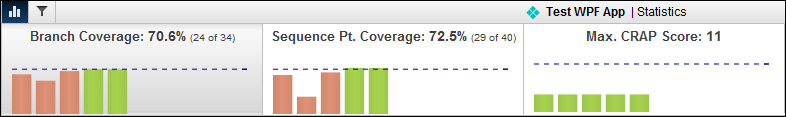
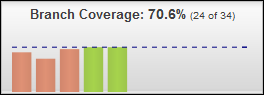
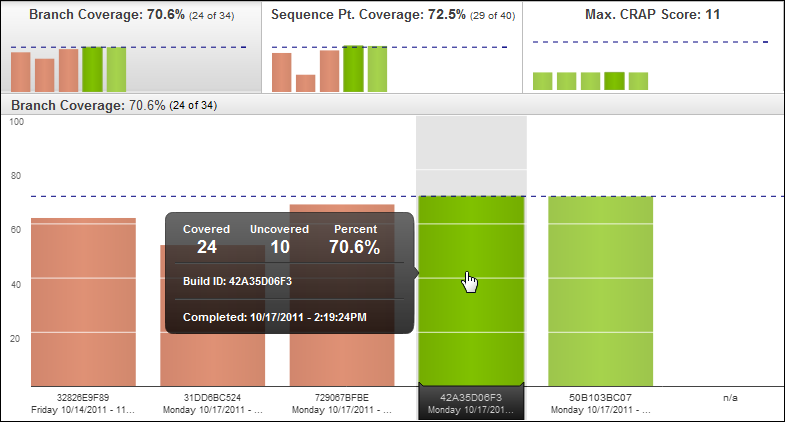
For reports like Branch Coverage, the header displays a percentage of coverage for the selected Execution, with the number of branches that were tested out of the total -- for example, 70.6% (24 of 34).
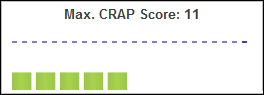
For statistics like Max CRAP Score, the numbers displayed will be quite different; for example, the only relevant statistic for this view is the total CRAP score of 11.
You can click any of the Statistics views to expand the chart and examine it in more detail from the Coverage Data View panel.
You can also minimize the Statistics view at any time by clicking  ,just below the NCover icon.
Coverage Data View
At every level of the Coverage Data View, five data points are available when mousing over each bar chart:
Covered - How many of the selected metric, for example, branch points, were covered (that is, tested) in the selected execution.
Uncovered - How many of the selected metric (for example, branch points) were not tested in the selected execution.
Percent - A percentage based on the Covered/Uncovered numbers.
Build ID - An identifier unique to the project assigned by NCover during profiling.
Completed - A timestamp to indicate when the selected execution finished.
Note that at the Module level  and below on the hierarchy, clicking on a bar causes its corresponding segment in the Statistics view to darken for emphasis.
Project Options
Now that you've collected coverage on a basic execution via manual test and test runner, here are some ways to refine your data collection:
Filters and Runtime Includes/Excludes
Then
NCover could include or exclude attributes, assemblies, files, methods, and types at runtime by using regular expressions, as specified in the Project Options of the Explorer, or on the NCover Console command line.
Now
The runtime include/exclude functionality of NCover 3x has been integrated into NCover Desktop's Filter Coverage. Filtering is available for every data view below the Home page and is applied by creating Filter Rules.
Click the
 to add a new filter.
Create a Name
Add a Description (optional).
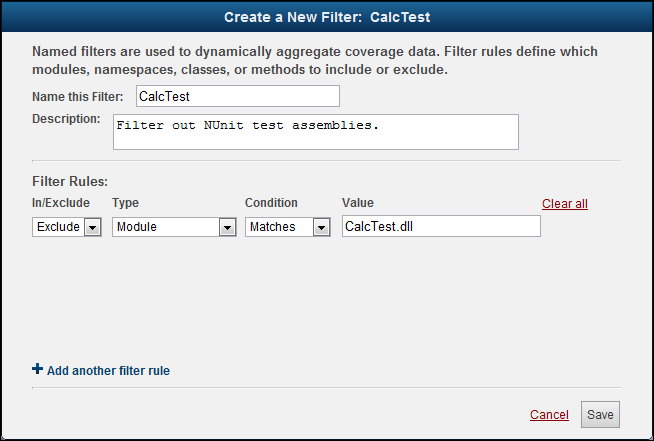
Filter Rules
Rules have the following configurable parameters:
Include or Exclude
Type - Module, Namespace, Class, Method, Attribute, Document Path, Branch Coverage, Sequence Point Coverage, Max Complexity Percentage and Max Complexity.
Condition - Matches, Starts With, Ends With, Contains, and Regex.
Value
Once you've defined your filter(s), click the  at any level of the data view to apply the rules you created in the steps above.
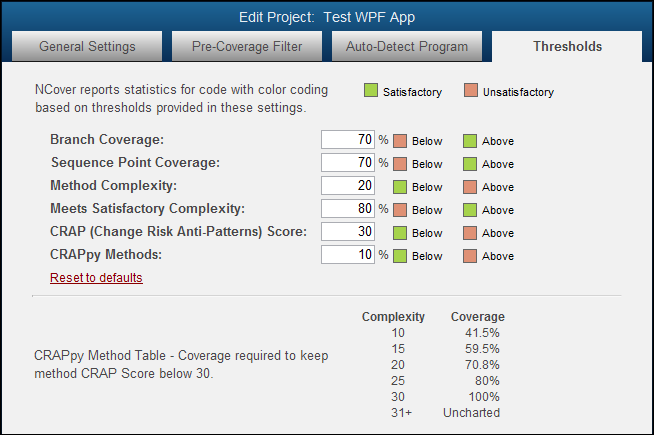
Thresholds
Then
Thresholds in NCover 3 were set for each project in Project Settings.
Now
NCover reports coverage statistics with color coding based on the thresholds provided in these settings, which are set with some reasonable default values when you create a project. You can reset these values at any time by clicking on Reset to defaults.
Merging
Then
In NCover 3, any number of coverage files could be merged via the NCover Explorer GUI or the NCover Reporting command line.
Now
By clicking the check-boxes to the left of each completed coverage Execution in the Project View, you can select multiple coverage files to merge by clicking the Merge button.
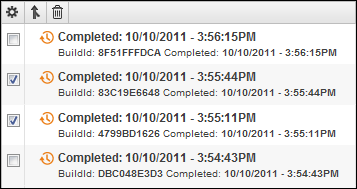
After merging, the files will be collapsed in the view and identified with the Merge icon. You can still view the executions individually by expanding the tree view of the merged file.
NCover will now merge coverage data for assemblies which are identical at the source code level. NCover 4.1.2101.816 is the first build to contain this new coverage merge functionality. This new merging strategy means that even assemblies with mismatched version numbers and binary hash can be merged if the source code can be verified as identical.
You can rename any execution by clicking on the title and selecting the edit icon. View the coverage logs (if any), by clicking on an execution and then clicking the log icon to display.
Remember that Logging options are set on the General Settings tab of the Edit Project dialog, using the "Logging Level" drop-down box.
Importing Coverage Data
You can import NCover Desktop coverage data from one machine to another, or import your NCover 3 coverage data file for viewing in NCover Desktop using a command line utility.
Note that NCover Desktop metrics, such as CRAP and Max Complexity, don't exist in NCover 3 and won't be visible in NC3 data imported to NCover Desktop.
Open a Windows Command Prompt and enter "ncover import" to see the coverage file export usage and syntax.
Syntax - NCover Import [<file.nccov>] <project name>
Project name - The NCover Desktop project to import from.
File.nccov - The name and path of the XML coverage file.
Default Behavior
Coverage file name -- Required. If you do not specify a coverage file name, NCover import will return an error.
Project name -- Optional. If you do not specify a project name, NCover import will create one based on the coverage file name.
Exporting Coverage Data
You can also export your coverage data file using the included command line utility.
The default export format is a Zip file containg JSON data, but another format option is an NCover 3 compatible XML file.
Open a Windows Command Prompt and enter "ncover export" to see the coverage file export usage and syntax.
Syntax - NCover Export
Project name - The NCover Desktop project to export from.
Execution match - Find by caption, build ID, or ending date/time.
File.nccov - The name and path of the output XML coverage file.
Default Behavior
Project name -- Required. If you do not specify a project name parameter, NCover export will return an error.
Execution match parameter -- If you do not specify a match parameter, NCover will export the last completed execution.
Output coverage file name -- If you do not specify a file name, NCover will use the project name and the current execution of the project specified in the project name parameter.