How Do I View the 4.3 Visual Studio Plug-in Data?
Viewing Coverage Data
The NCover 4.3 Visual Studio plug-in offers several intuitive ways to access and display your coverage data right in the VS environment, so code coverage is available without ever leaving your project.
1. NCover Menu
The default selections seen below -- Highlight Code and View Coverage Data -- will ensure that any available coverage metrics are automatically displayed and highlighted as soon as you open a document that has associated coverage data.
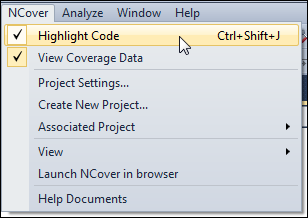
Whether you collect coverage from the Desktop Explorer, or from a project created in Visual Studio, documents with available coverage data will automatically display code highlights in the document window.
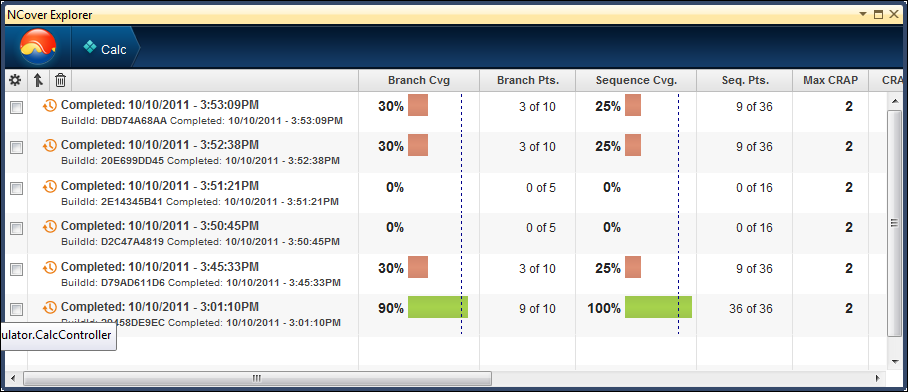
2. Solution Explorer
Right-clicking on a document in the Solution Explorer will also display associated coverage data in an NCover Explorer window, which can be floated, docked or tabbed as needed.
The Explorer will open to the Assembly view. You can scroll across the window to view the entire statistical summary for the loaded assembly.
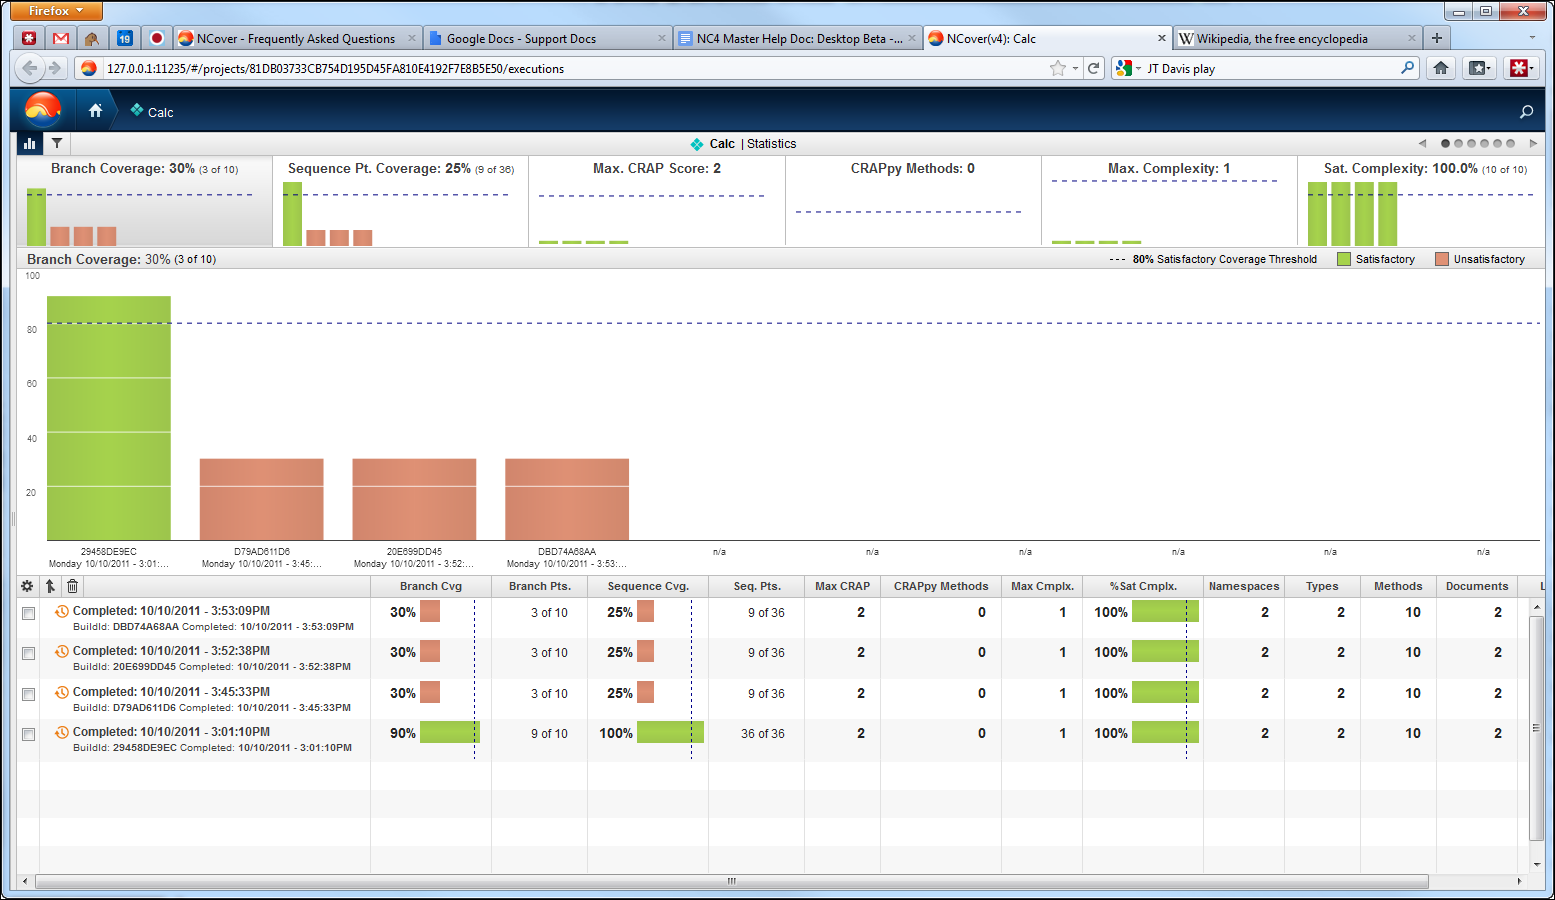
Once an Explorer window is open, you can navigate to any level of the Coverage Data View from the hierarchy menu. You can go all the way up to the Executions view:
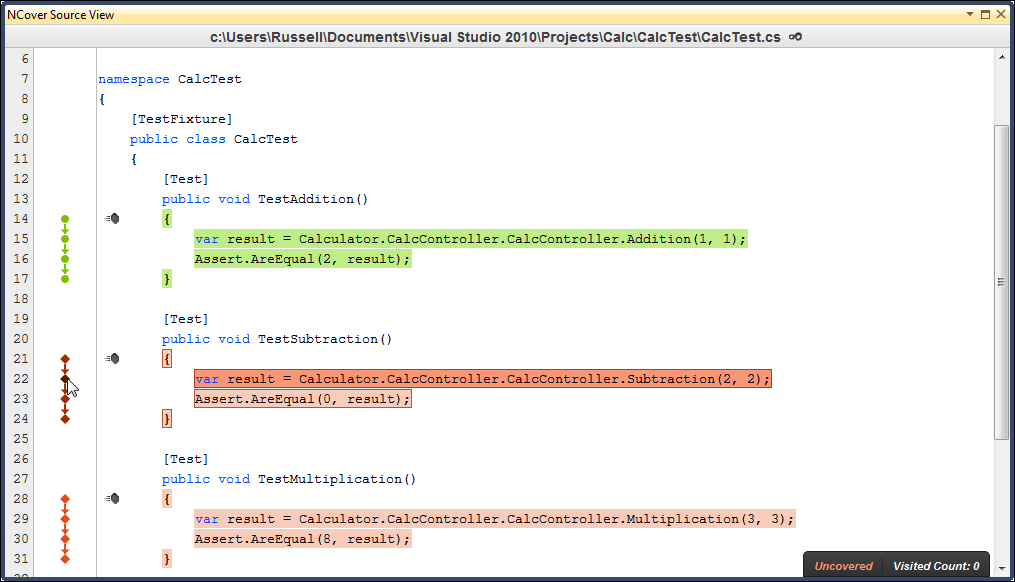
Or, you can continue drilling down through Namespace, Assembly, and Method to the Source Code view, where Covered and Visit Counts are displayed in a pop-up when hovering, along with Branch Visualization and coverage highlighting.
3. Source View
Right-click in the source code view and select "Show Coverage Data" from the pop-up menu. The NCover Source View window will display the coverage data, along with Branch Point Visualization and Visited Count.
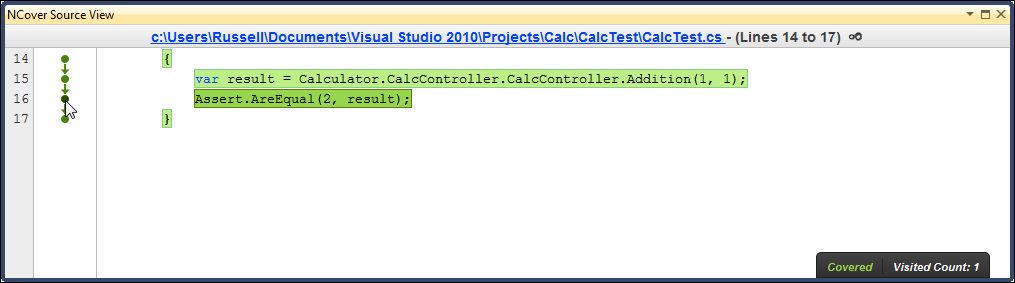
Clicking the code line link at the top of the Source View window will display coverage for the entire document.
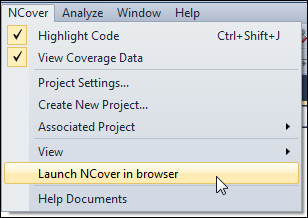
4. Browser View
Right-click on the NCover menu and select "Launch NCover in browser" from the pop-up menu.
The NCover Explorer will open in a new tab in your default browser.
If your browser type or settings don't allow this, then NCover will open in its native browser format.
More About the NCover Explorer
Once you've opened the Explorer, a whole rich, new interface is available to help you make the most of your coverage data.
For more detail on the NCover Explorer, see the Navigation section and following of the "Getting Started with NCover 4 Desktop" guide.
4. Other Views
Once you've established a context for the source code using any of the above methods, you can use the NCover menu View options to open/bring forward a separate coverage data view.
Selecting "Explorer View" will open an NCover 4 window:
Note: if no coverage context has been established, selecting one of these options will display a message window:

NCover 4 Program Data
NCover 4 saves project data and error logs in different locations, depending on your operating system.
Location of NCover program data by platform:
Vista, Windows 7, Server 2k8:
NCover Project Data: %ProgramData%\NCoverProjects NCover Error Logs: %ProgramData%\NCoverErrorReports
Windows_XP, Server 2k3:
Common Application Data: %ALLUSERSPROFILE%\Application Data\NCoverProjects
NCover Error Logs: %ALLUSERSPROFILE%\Application Data\NCoverErrorReports