Measuring Code Coverage Without Symbols or Source Code
Increasingly, customers are using NCover to gather code coverage in production scenarios (or mock production scenarios). In fact, many of the improvements we've made in NCover have been focused on:
- Gathering coverage with as little performance impact as possible.
- Requiring little to no configuration settings when gathering coverage.
Consider this test scenario: A development team wants to collect coverage data on their code while it's being run through its paces by an automated test suite. They have a continuous integration process which builds an installation package on their build server. The build server contains all of the code, debugging symbols and other artifacts related to each version of the installer package which is generated.
On the other side is the staging environment, which is built to reflect what their customer's environment will look like when the application is deployed. When a build completes, they run the newly generated installer on the staging server. This server is configured just like a customer's installation would be configured. There is no source code, symbol files or other build artifacts on this server other than the installed application.
In this staging environment the team uses manual testing along with automated scripts to test the application. That's where code coverage comes in. How can we collect coverage data on the application running in the staging environment without access to the debug symbols, or source code? This is where NCover introduced a new innovation that makes it possible...easy even...to collect coverage in this scenario.
NCover splits the coverage process into two separate phases...
- The static analysis phase runs on the build server and requires source and symbols (to be able to report detailed results. It can run without source and symbols to produce more limited metrics).
- The runtime phase runs on the machine under test and does not require any symbols or source code. The two sets of data are later combined together producing the same detailed coverage analysis that would have been otherwise produced.
This has the following benefits:
- The runtime collection is faster and more lightweight. In fact, due to this change, NCover uses several orders of magnitude less memory in many cases than NCover 3.
- The static analysis can be done as a one-off process...even as part of your build script. And it does not need to be done on the same computer as the one on which the tests are running
- The static analysis only needs to be run once per unique build. Many runtime collections can be run after that using the same static data.
How do we accomplish this? NCover has a new command called "Analyze" that runs the static analysis process on your assemblies and pushes the data to NCover (and up to Code Central, if you are using it). Then later, when coverage is collected at program runtime, the data is combined on the server side to produce detailed coverage results. Let's walk through an example to see how this works in practice. I'm going to use our sample CodeBlaster game as an example.
On your build server - The Static Phase
- I've just finished running the build and it has completed successfully. The output files we are interested in are CodeBlaster.exe, Algorithms.dll, and Box2DX.dll.
From the build server, I'm going to run analyze on each file from the command line to register these assemblies with NCover.
C:\BuildOutput\Debug>NCover analyze64 --force --sync CodeBlaster.exe
NCover.Analyze v4.1.2042.572
Copyright (c) 2003 - 2012 NCover LLC

Analyzing assembly [CodeBlaster.exe]...
Original Assembly: CodeBlaster.exe
Temporary Assembly: ...\Temp\nc4F3B6.tmp\CodeBlaster.exe
Hash: C48801AD2396D7921AD720EBA1F587BF7D976A8E

Completed in 5.50874 seconds.

C:\BuildOutput\Debug>NCover analyze64 --force --sync Algorithms.dll
NCover.Analyze v4.1.2042.572
Copyright (c) 2003 - 2012 NCover LLC

Analyzing assembly [Algorithms.dll]...
Original Assembly: Algorithms.dll
Temporary Assembly: ...\Temp\nc457C0.tmp\Algorithms.dll
Hash: 9A7E7EB58D647237C95AA787E751503DE06F00F0

Completed in 5.6304 seconds.

C:\BuildOutput\Debug>NCover analyze64 --force --sync Box2DX.dll
NCover.Analyze v4.1.2042.572
Copyright (c) 2003 - 2012 NCover LLC

Analyzing assembly [Box2DX.dll]...
Original Assembly: Box2DX.dll
Temporary Assembly: ...\Temp\nc4969E.tmp\Box2DX.dll
Hash: EAAE1D2179BC4090E8F95D9C61B2279D6359C6D4

Completed in 14.8811 seconds.
The --sync option tells the local copy of NCover to push the static analysis data to the Code Central server. If I hadn't specified that option, then the data would remain only on the local system.
The --force option tells the system to go ahead and run the analysis and sync the data even if it already has data for this assembly in the system.
On the Code Central server - Setup the Project
Now, we'll switch over to the server that's running Code Central. Let's go ahead and create a project for the CodeBlaster program on the Code Central server. We'll use a simple RegEx match rule to specify that we want to collect coverage on the CodeBlaster program.
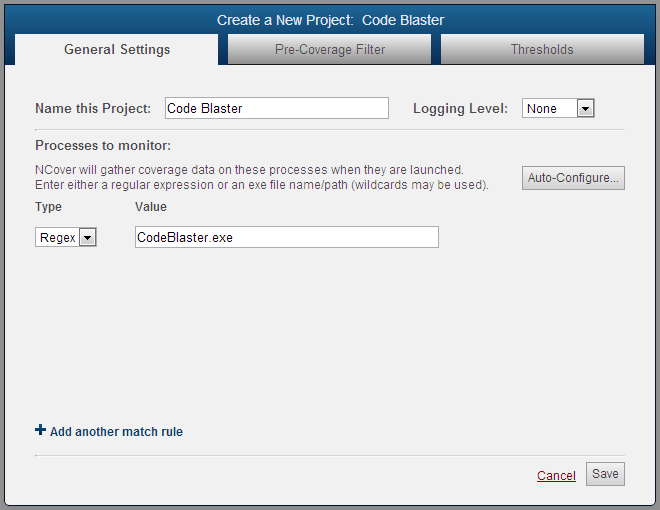
As soon as I save it, the newly created project will sync to the copy of NCover running on the staging environment. So let's switch to the staging environment and run the program.
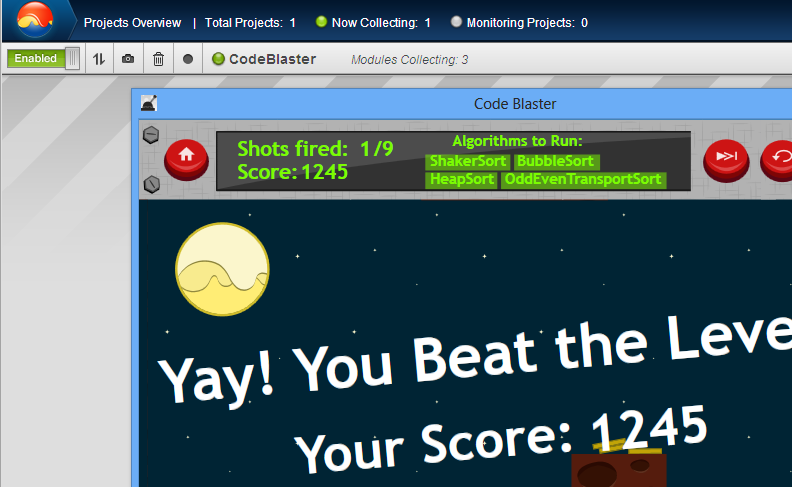
In the staging environment - Collecting coverage at Runtime
In the staging environment, normally a test script would install the program that is to be tested. For this simple example, I simply copied the .dlls over to the computer. Note that there are no pdbs or source code being installed, only the program itself. Let's go ahead and run CodeBlaster. If you check the local NCover window, you should see the local copy of NCover capture coverage and then sync it up to the Code Central server when the program shuts down.
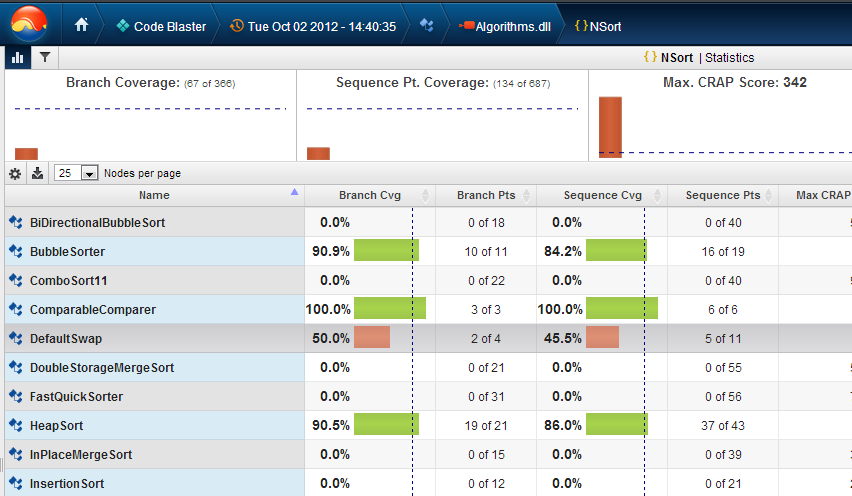
Back to the Code Central server - Viewing the Results
Now we go back to the Code Central server to see the results. Here you can see that we get sequence point coverage (which requires debug symbols) for Code Blaster even though it was run on a server without access to debug symbols or source code.
Similarly, we are able to see the source code with coverage highlighting as well even though coverage was collected without access to the source code.
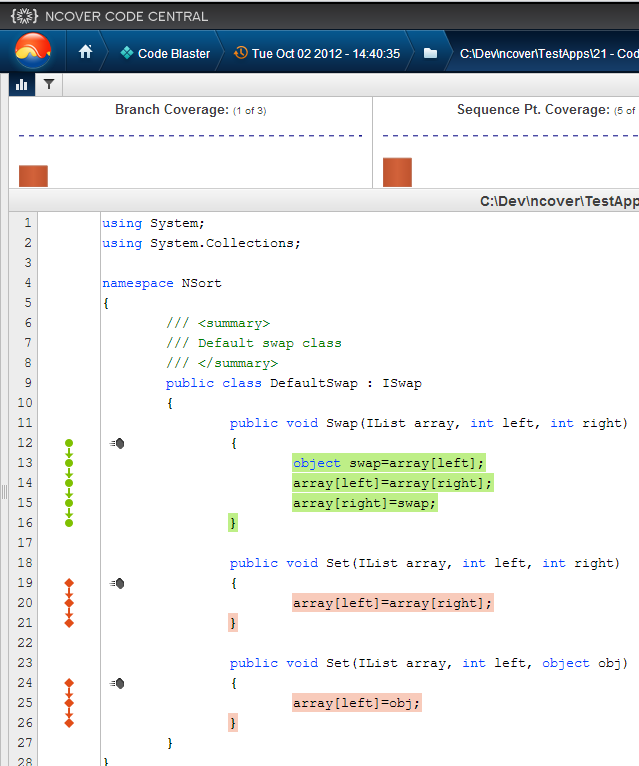
You can see that we are able to drill down to sequence point coverage details and highlighted source code on the Code Central server even though coverage was collected on a computer where none of the build artifacts existed.
Conclusion - So what does this mean?
Normally NCover combines the static and runtime analysis in the background in order to make collecting coverage data as quick and efficient as it can be. However, as we've seen in this article, these two processes can be split across machines in order to get better data without having to spread your source code and debug symbols to every testing machine in your development shop.
This capability should make it far easier for you to collect coverage in production or simulated production scenarios where you only have access to the shipping code. Please let us know what you think of this new feature and how you use it.