Navigation
Then
NCover 3 navigation was primarily via the tree view, the source code window and various menus of the Explorer interface.
Now
NCover Code Central offers several more intuitive ways to manage, view and drill-through your coverage data.
The "breadcrumb" hierarchy at the top of the Explorer shows where you are in the coverage data -- by Project, Execution, Module/Document, Namespace, and Method -- and allows you to easily move back up as many levels as you like.

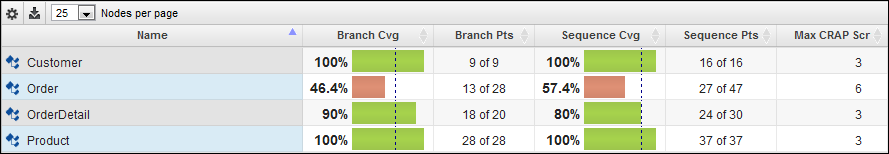
In the bottom panel, the Coverage Navigator also shows you what level of coverage you're viewing, along with what specific Modules, Documents, Namespaces, Assemblies or Methods are currently loaded.
Besides your location, the Navigator also displays a customizable summary of all available code coverage metrics on each line (see Column Display below).
All NCover products run by default in HTML5-enabled browsers, so you can navigate through and bookmark Code Central pages as you would in any web application.
Column Display
You can choose which code coverage columns are displayed in the Coverage Navigator by clicking  in the upper-left corner of the panel.
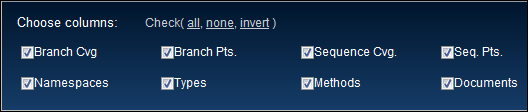
Column selection is global, meaning different columns cannot be set at each level of the Coverage Navigator, but columns can be modified at any time and the display will update immediately to reflect the new selections.
Drilling Through Data
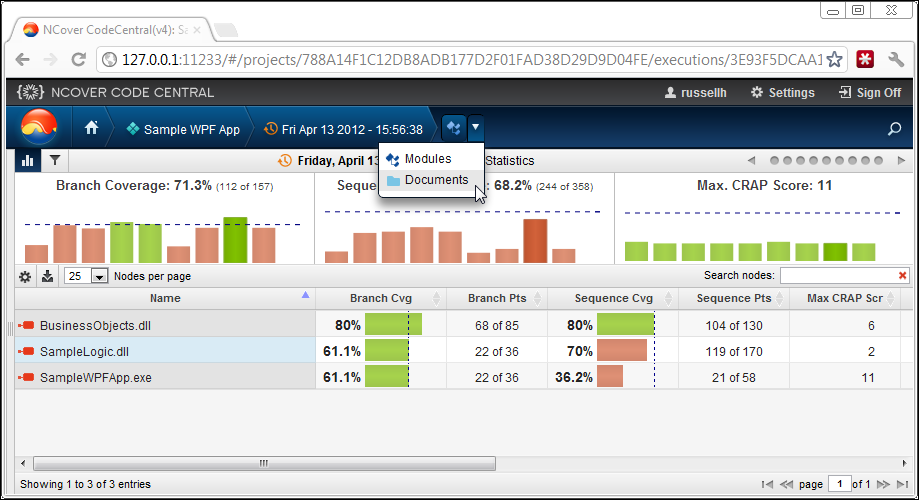
After selecting a Project on the Home page, click to display the Execution view.
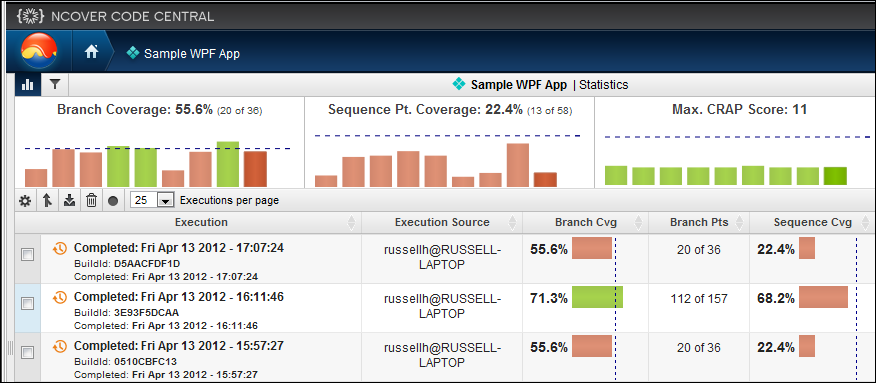
click on an Execution to drill down to the next view, which defaults to Modules, with Documents also available.
Click on a Module to continue drilling through Namespace, Assembly, and Method to arrive at the Source Code view, where Covered and Visit Counts are displayed in a pop-up when hovering, along with Branch Visualization and coverage highlighting.
In the lower right corner of the Source Code window, the coverage status is indicated by simple red or green text coloring of the word "Covered" in a pop-up window, activated by mousing over lines of code.
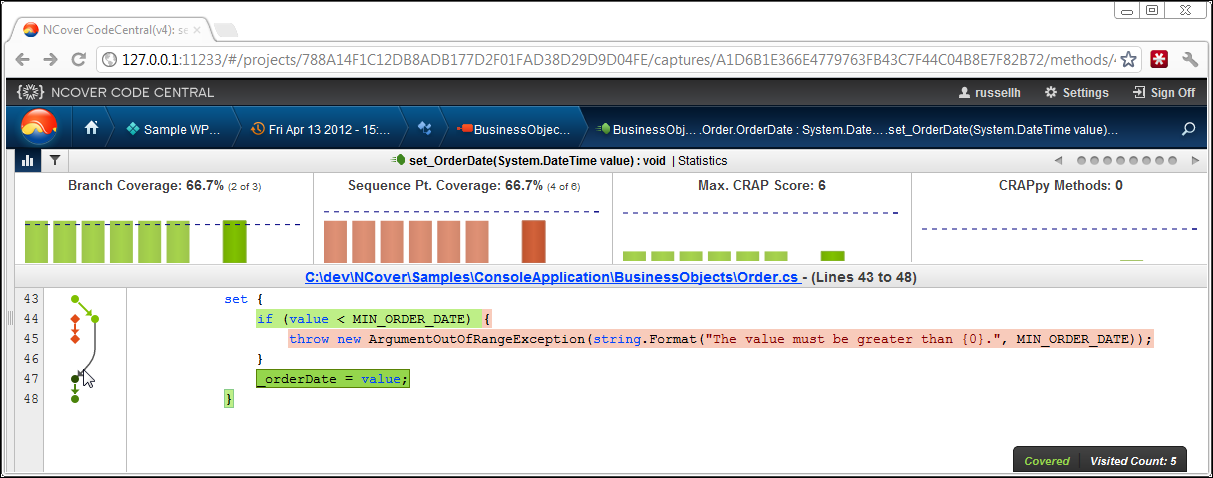
The number of Visit Counts is also displayed in this pop-up when hovering.
Branch Visualization, a graphical display of the possible paths through the highlighted code, is displayed to the left of the source code, and coverage highlighting appears on the code itself.
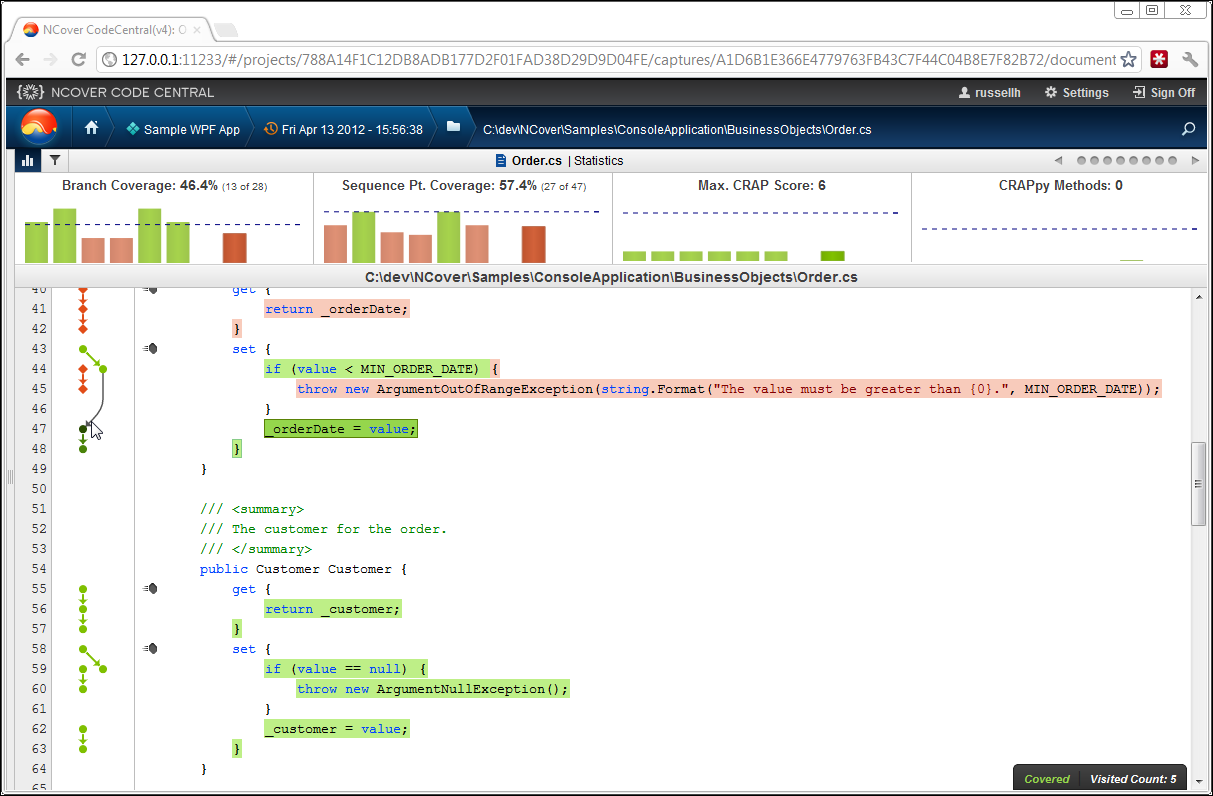
Clicking on the document link in the Source Code View will display the entire document, rather than the lines of code contained in the method you drilled-down on.
You can refresh your coverage data anytime from the drop-down menu below the NCover icon on the Home view.
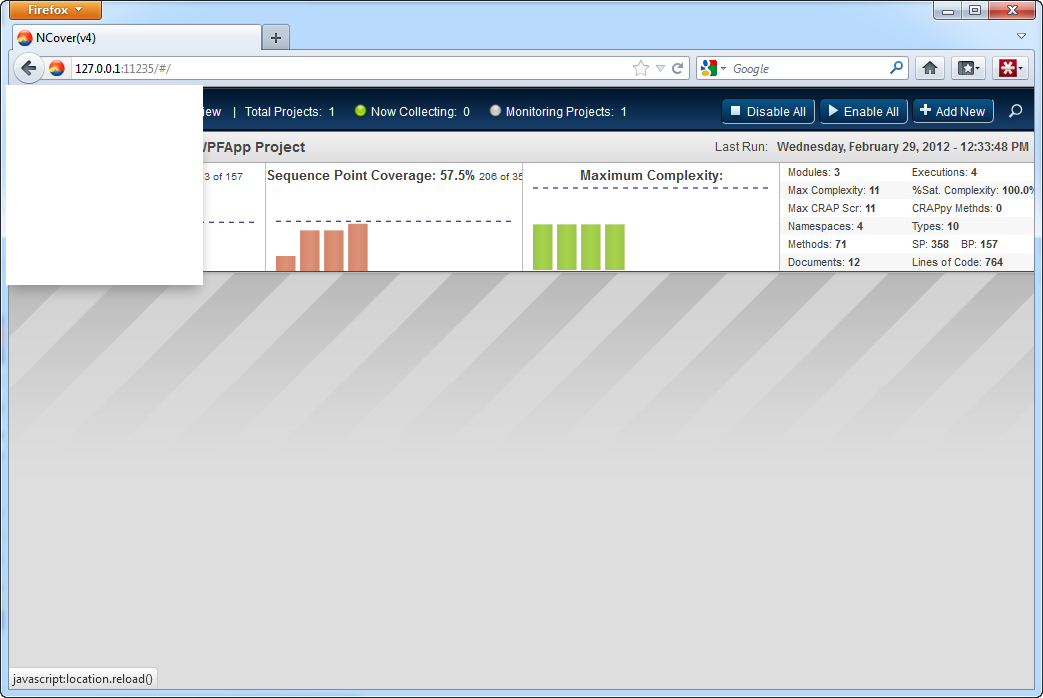
Code Central will also alert you with a toast pop-up notification at the top of the Explorer window when new coverage data is available.
