What is Collector?
NCover Collector is the workhorse of the Code Central server. Collector runs the NCover Service, which does the code profiling, but projects cannot be created or modified in Collector, and are pushed down from Code Central in a read-only view.
Each Collector is connected to the Code Central server. After Collector gathers coverage on a locally-running executable or unit test, it automatically sends the coverage data to Code Central, where it can be fully analyzed.
Installation
NCover Collector is installed locally and accessed by launching the Collector browser after installation is complete.
Viewing a Collector Project
All coverage projects must be created and configured in Code Central. After a new project is saved, or an existing project modified, the new/changed settings will be automatically synced with all connected instances of Collector.
General Settings
Note: All coverage projects are created and configured in Code Central. Project details are read-only in Collector.
From the Home view of the Code Central, click Add New to open the "Create a New Project" window.
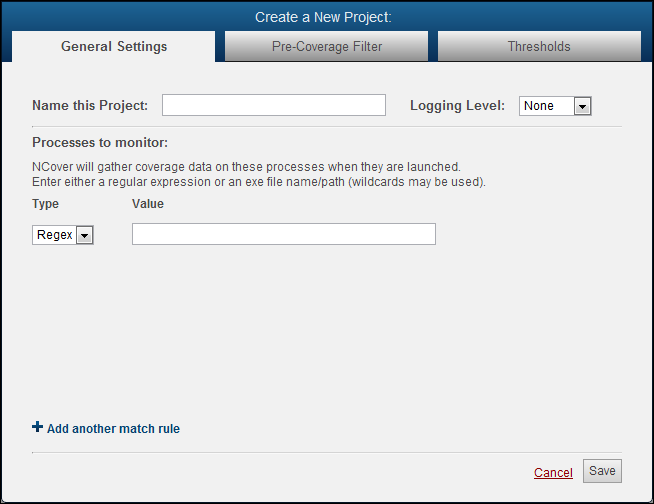
From the "General Settings" tab, name the project and then use a regex or file path to specify the executable that will be covered on the local machine where the Collector is installed.
For example, the file path option would be "C:\dev\TestApp\TestApp.exe".
The regex option would be simply "TestApp.exe", or "testapp.exe", as the regex isn't case-sensitive.
When your project selections are complete, the projects will be automatically synced to connected instances of Collector and set to Enabled by default.
Pre-Coverage Filter
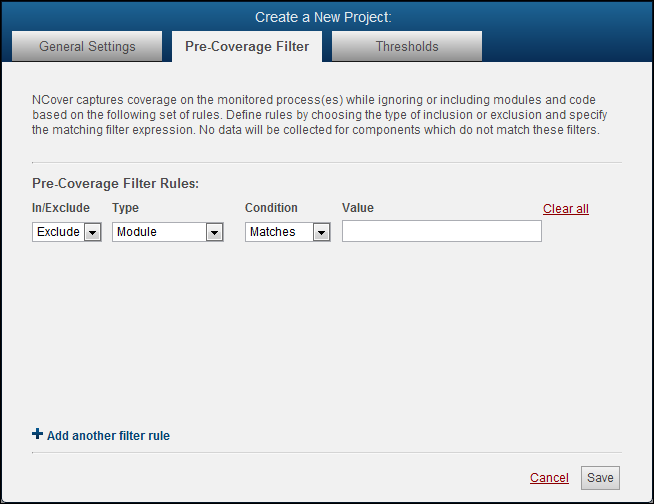
The Code Central admin can include or exclude attributes, assemblies, files, methods, and types at runtime by using regular expressions, as specified in the Filter Rules of the Pre-Coverage Filter tab.
 You can cover only the code you care about and shorten collection times by specifying what assemblies Collector should or shouldn't be watching.
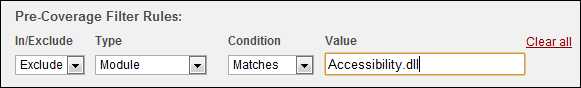
Collector will gather coverage on any code loaded when the executable defined in the previous step runs, but you don't always want to collect coverage on everything -- Microsoft Active Accessibility code, for example.
Click the
 to add a new filter.
Create a Name
Add a Description (optional).
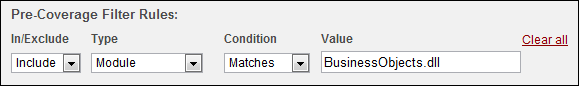
Filter Rules have the following configurable parameters:
Include or Exclude
Type - Module, Namespace, Class, Method, Attribute, Document Path, Branch Coverage, Sequence Point Coverage, Max Complexity Percentage and Max Complexity.
Condition - Matches, Starts With, Ends With, Contains, and Regex.
Value
Using the example of the Microsoft Active Accessibility module we discussed earlier, a filter rule to exclude that code would look like this:
You can also create a filter to include only the code you care about, and ignore everything else, by specifying your assemblies with an include rule:
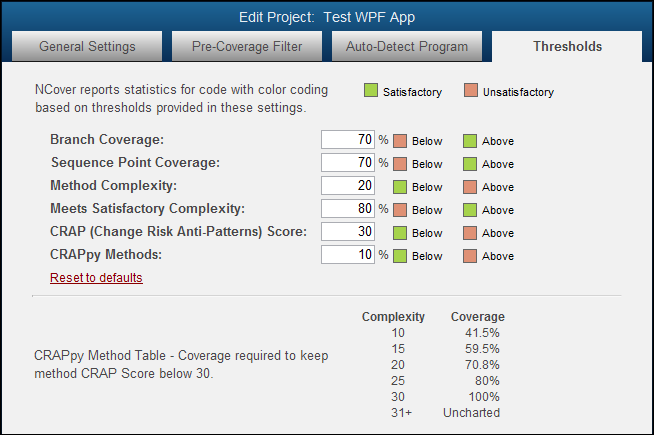
Thresholds
Code Central reports coverage statistics with color coding based on the thresholds provided in these settings, which are set with some reasonable default values when you create a project.
Collecting Coverage
Go to Collector on the local machine and open a browser window (Collector is assigned 127.0.0.1:11233 by default at install) to verify that your project has been successfully synced to Collector.
Now Collector will automatically gather coverage every time your application runs on the local machine or build server.
If you start your covered application manually or run a build script with your unit tests, you'll see on the Collector Home page that the light beside your project is pulsing green to indicate coverage is being collected.
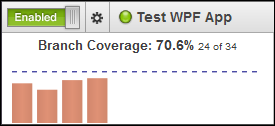
Immediately to the right of your project name, the Modules Collecting counter displays the number of modules being profiled in the current execution of your project. The number may fluctuate while coverage is running, but will reach zero when profiling is complete.

When your tests are complete, don't forget to stop the application to end profiling and allow Collector to gather the coverage data.
Since the purpose of Code Central is to consolidate and analyze all coverage results, as soon as Collector syncs the coverage data with Code Central successfully, the coverage results are removed from Collector.
The only time coverage information is normally displayed in Collector is when an execution has not been sent to Code Central.
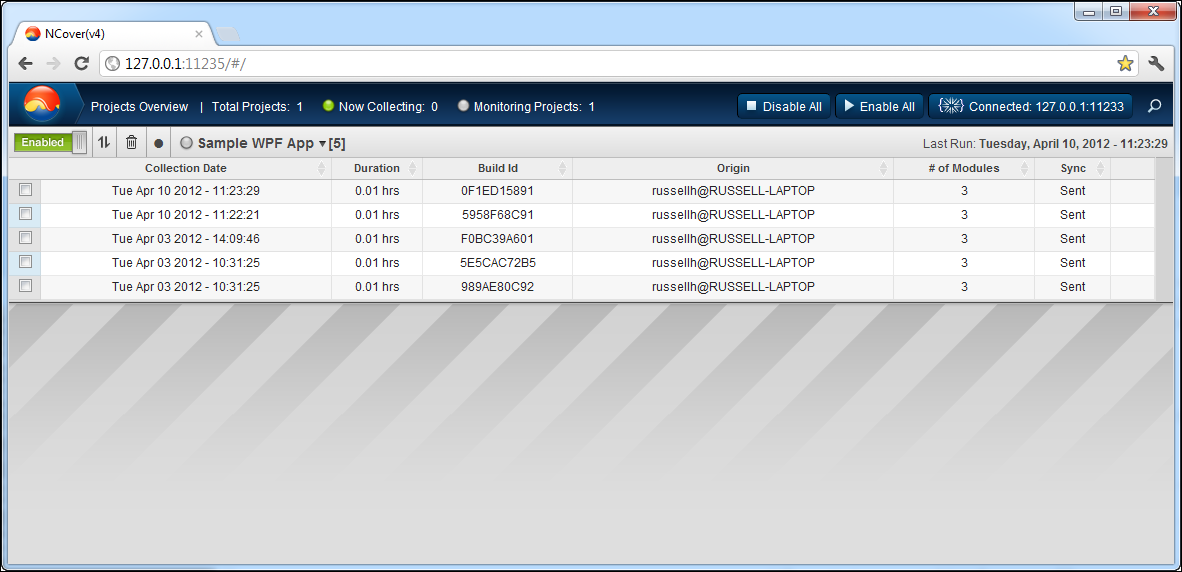
Execution Details
Each Collector project view displays the following execution detail data, which can be collapsed by clicking on the project name.
Collection Date - The day/month/year/date/time stamp(s), displayed in ascending order, by default.
Duration - Time elapsed in hours to the one-hundredth decimal place.
Build ID - A unique GUID assigned to each execution.
Origin - The machine name where the coverage was collected.
# of Modules - The number of modules covered in the specified execution.
Sync - Sent or Unsent.
Mark Unsent
Use this feature to send execution data that has been paused using Project Sync Options > Pause Data Upload, or to resend data that is incomplete, outdated, or appears corrupt back to Code Central.
Clicking on  will mark any executions whose checkboxes have been selected as Unsent.
Once selected, the status in the Sync column will change to "Unsent" until the data is successfully uploaded to Code Central.
When the sync is complete, the status in the Sync column will change to "Sent" and then the coverage results will be removed from Collector.