So What's New?
We've reworked how we manage coverage data in NCover, and it has led to performance improvements in many operations, including loading coverage files. It has also finally united the way that NCover and NCover Explorer work, giving a more fluid experience between the applications. With that unification process finally completed, we were able to drive forward with some new features that we're excited to tell you about. There are now three primary components to NCover:
- Explorer: The user interface is designed for use at the developer's desktop, giving rapid insights into code.
- Console: The command line is designed for use on the build server, empowering teams to apply code coverage during the build, including failing the build if coverage numbers are not acceptable.
- Reporting: The reporting tools are designed to permit a developer, tester, or manager to gain insights into their code and into code coverage trends over time.
Performance
We've reworked how we manage coverage data in NCover, and it has led to performance improvements in many operations, from loading coverage files to merging. Using NCover has never been quicker, with coverage times decreasing up to 50%; that means faster results and less wasted time.
Trends
Knowing how your project's coverage has changed over time can help you spot patterns, identify problem areas, and keep development moving forward. We've been dreaming of trends for a long time and in 3.0 they're finally here. Create them by telling NCover where to save them: we do the rest of the work. Once you've recorded trends you'll be able to create html reports with graphs of how your coverage has changed over time and you'll also be able to see those trends in NCover Explorer.
Integration
Developers use many tools to do their job, so we've made life easier by improving integration with major test tools like NUnit and MSTest, and providing a script generator for those times when you have to write a build task. Using NCover on a build server has gotten easier too, with new build tasks and more intuitive parameter names so you can figure out what you wrote 3 months ago. We've worked hard with the people at Typemock to make sure NCover plays well in their sandbox, so you can retrofit NCover and testing best-practices into existing projects without going through an expensive redesign.
New Metrics
We've improved the Method visits metric and integrated it all the way down the NCover stack. You'll find it in every report and every trend, and we've created some exciting new reports for it. Branch Coverage has been baked into NCover Explorer and shows up everywhere from the project options to the trend graph to the new search results. We've also added Cyclomatic Complexity, an entirely new metric that helps you pinpoint the methods and classes that need refactoring and immediate attention.
Better Reports
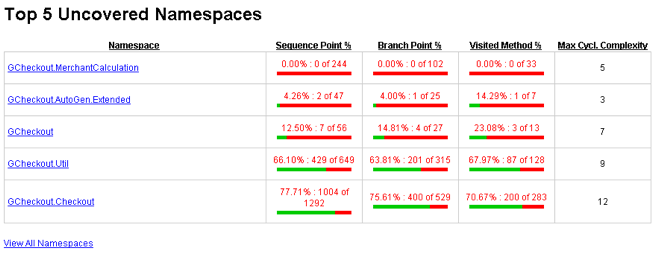
We've added 16 new reports to NCover 3.0, and lest you confuse quantity with quality, we've redesigned them to be easier to understand and faster to create. We've added reports that focus on the most uncovered areas of your code, jump-starting you on the path to better code. There are reports that show the methods and classes with the highest Cyclomatic Complexity, reports that show methods that haven't been touched by any test, and better reports for management.
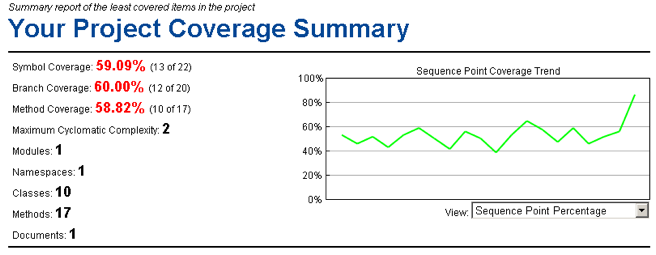
We felt like it was important to help you more strategically attack uncovered code, so we have replaced the old html report index with a new summary report that tells you the top 5 worst coverage offenders in several different categories.
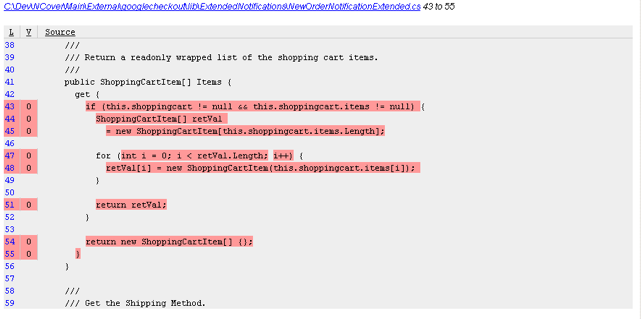
Since coverage is ultimately about digging in and writing tests for uncovered code blocks, we wanted to give you a way to find the blocks to attack at a glance. That's why we created the Uncovered Code Report. The Uncovered Code Report shows your top 25 blocks of uncovered code so that you'll always have a good place to start improving your coverage.
Faster Search
NCover 3.0 sports a new search interface that's easier to get to and returns results in microseconds. Can't find a class? Search. Click on the class name in the results view and NCover Explorer will jump straight to that class in the tree, showing coverage statistics, trends, and the source code for the class.
Power
Hovering over an element in the tree used to show the element's full name. Now it shows complete coverage stats for the element, including trends, reducing the number of times you have to drill down just to see data. NCover supports a full range of include and exclude options, letting you quickly, easily, and accurately gather just the data you're interested in. NCover Explorer expands that power, letting you define a full range of include and exclude filters to trim the presented data down to what you're interested in at a particular moment, while still keeping the other data around for later. The new Minimum and Satisfactory coverage thresholds on the reporting tool allow you to precisely specify a broad range of business requirements, letting you handle the complexities and dependencies of a large project with ease.