Coverage Statistics
At the Project View and below, the Statistics view in the top panel of the Explorer window displays data relevant to the selected Execution.
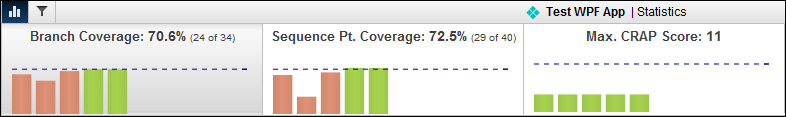
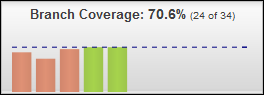
For reports like Branch Coverage, the header displays a percentage of coverage for the selected Execution, with the number of branches that were tested out of the total -- for example, 70.6% (24 of 34).
For statistics like Max CRAP Score, the numbers displayed will be quite different; for example, the only relevant statistic for this view is the total CRAP score of 11.
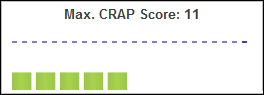
You can click any of the Statistics views to expand the chart and examine it in more detail from the Coverage Data View panel.
You can also minimize the Statistics view at any time by clicking  ,just below the NCover icon.
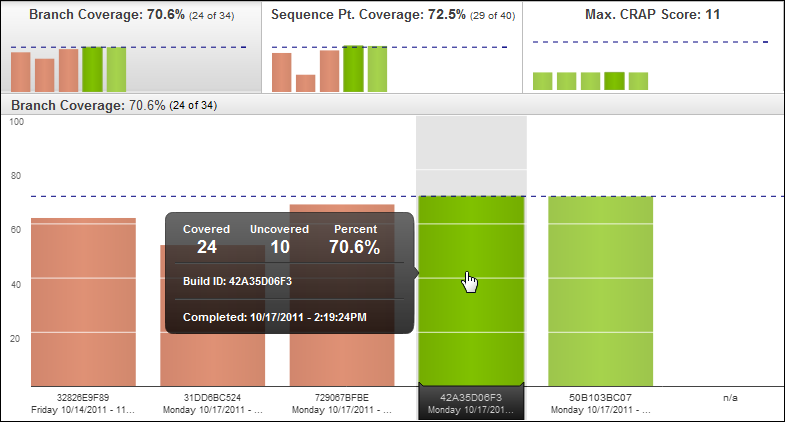
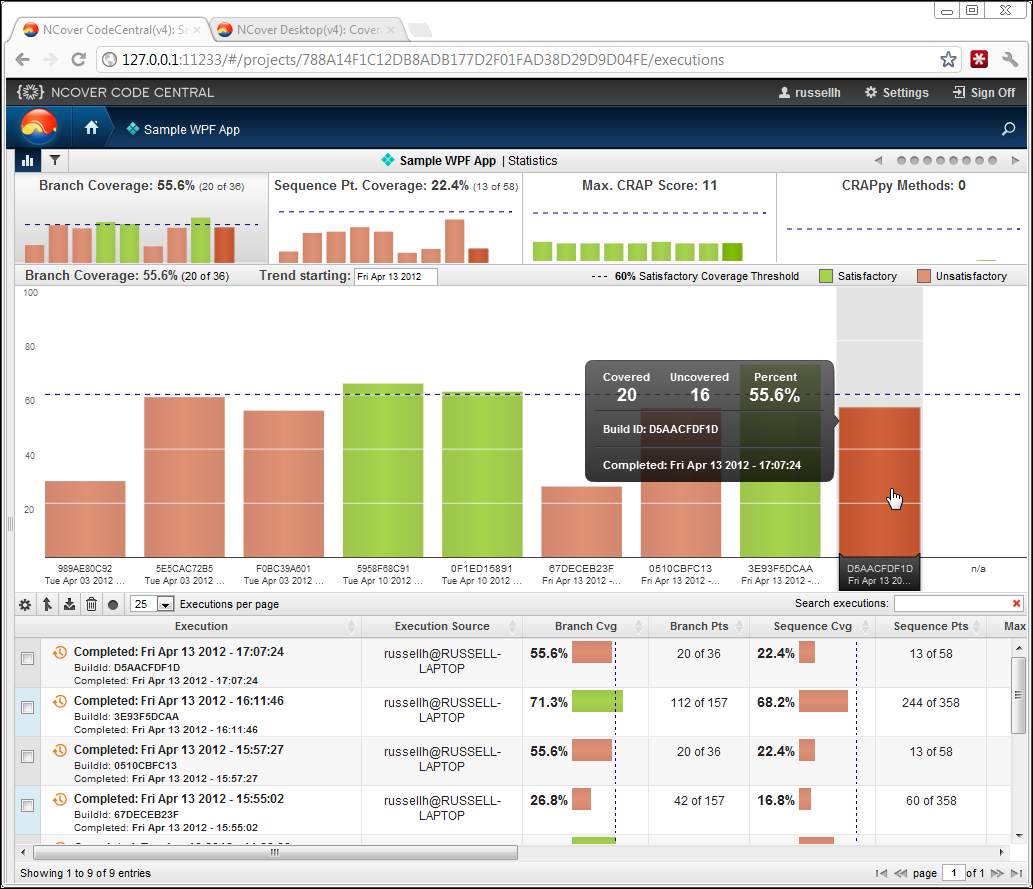
Coverage Data View
At every level of the Coverage Data View, five data points are available when mousing over each bar chart:
Covered - How many of the selected metric, for example, branch points, were covered (that is, tested) in the selected execution.
Uncovered - How many of the selected metric (for example, branch points) were not tested in the selected execution.
Percent - A percentage based on the Covered/Uncovered numbers.
Build ID - An identifier unique to the project assigned by NCover during profiling.
Completed - A timestamp to indicate when the selected execution finished.
Note that at the Module level  and below on the hierarchy, clicking on a bar causes its corresponding segment in the Statistics view to darken for emphasis.