Covering QTP
NCover Desktop runs as a service, so it's already monitoring, ready to cover any .NET code executing on your machine, including scripted code testing by applications like the popular QuickTest Professional (QTP) software from HP.
An important consideration when setting up NCover to work with QTP scripts is your code coverage goal.
To see coverage on the code that is exercised by QTP scripts only, there's no need to have NCover profile the QTP process -- just find the tested application and let NCover gather coverage data on the source code.
Having NCover profile QTP and any processes it starts won't change your coverage numbers -- the same source code will be loaded by the QTP scripts and profiled by Desktop whether NCover monitors QTP or not.
One reason to have NCover monitor QTP as well as the tested application would be to gather data on the actual execution and performance of the QTP scripts, so if this is one of your goals, NCover can profile all the processes you specify.
1. Creating a Project
From the Home view of the NCover Explorer, click  to open the "Create a New Project" window.
2. Settings
Finding the right process to profile is the key to successful coverage. Profiling is accomplished with match rules, so let's talk about how they work and the options for creating them.
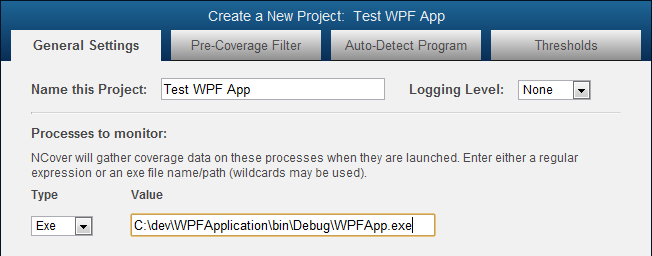
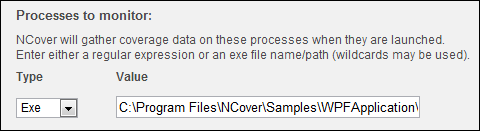
From the "General Settings" tab, name the project and then use an Exe or Regex to specify the test runner process -- for example, "C:\dev\QTP\bin\qtpro.exe".
3. Auto-Configure
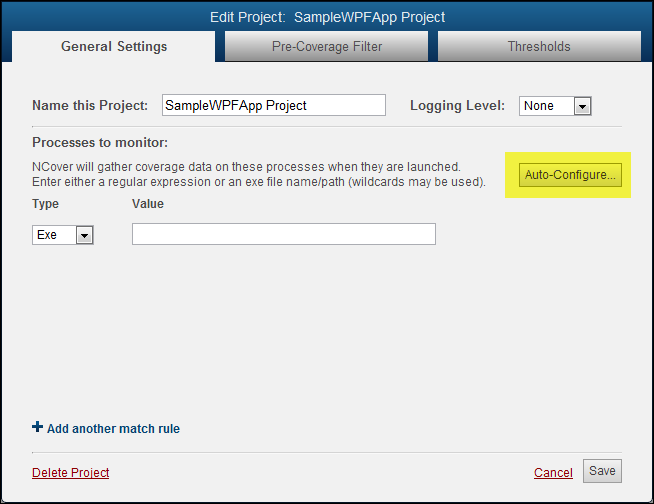
Another option is to click on the Auto-Configure button and let NCover create match rules for you.
The General Settings tab will switch to the Auto-Detection view and start monitoring for .NET processes as soon as you click on Auto-Configure.
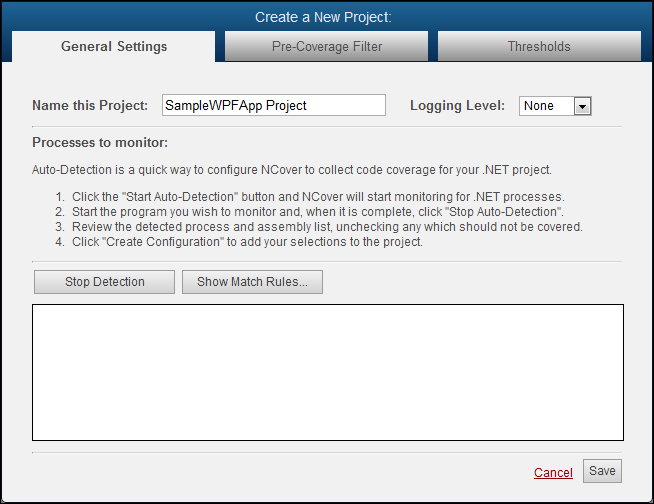
Start your application, and the executables and assemblies that are being loaded will display in the detection window.
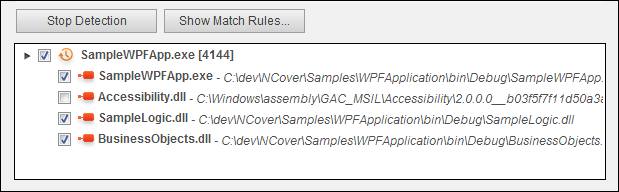
Review the list and uncheck any items that shouldn't be covered.
Note that Desktop automatically excludes some common code, such as the Accessibility.dll
Click Stop Detection when your selections are complete, and Restart Detection, if necessary, to re-capture your processes/assemblies.
Click Show Match Rules to view the processes you selected.
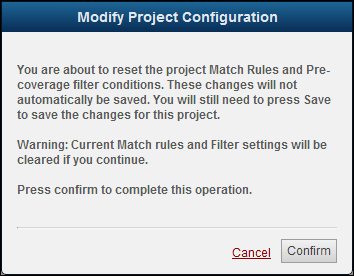
Note: If you have already saved project settings, a pop-up will alert you that confirming the configuration will reset the Match Rules and Pre-Coverage filter conditions, but these changes are not automatically saved. You will still need to press Save to commit the changes for this project.
Click Save to accept these selections, or Auto-Configure to start over.
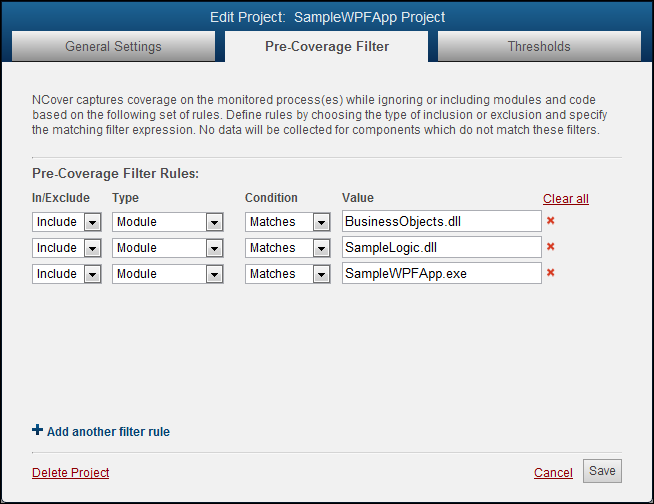
Note: "Include" filters will be automatically created based on the detected modules that you selected. You can review the filters on the "Pre-Coverage Filter" tab.
4. Collect Coverage
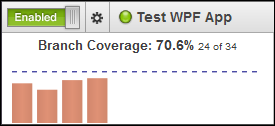
When your project selections are complete, start or re-start your tested application and run your QTP scripts. Go to the Home page and you'll see that the light beside your enabled project is pulsing green to indicate coverage is being collected.
Immediately to the right of your project name, the Modules Collecting counter displays the number of modules being profiled in the current execution of your project. The number will fluctuate while coverage is running, but the counter should eventually disappear when profiling is complete.

When testing is complete, close your tested application and NCover will automatically start compiling the coverage data.
As soon as processing is complete, the results will be automatically displayed below your project on the Home page.
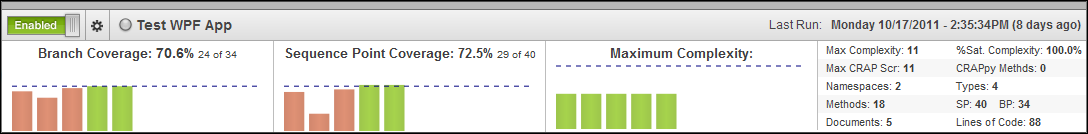
Desktop makes the process of collecting code coverage simple, and then gives you access to dynamic and powerful views of coverage trends.