Visual Studio Plug-In Coverage Scenarios
NCover 4 runs as a service, so it's already monitoring, ready to cover any .NET code executing on your machine.
This ability to gather data globally is key to understanding how to leverage the power of NCover 4. When setting up any project the first question you should ask is, What process do I want to cover? If NCover 4 can find the executable or service that's exercising your code, it can collect coverage data.
Covering a Windows Service
1. Creating a Project
From the Home view of the NCover 4 Explorer, click Add New to open the "Create a New Project" window.
2. Settings
As described earlier, finding the right process to profile is the key to successful coverage. Profiling is accomplished with match rules, so let's talk about how they work and the options for creating them.
From the "General Settings" tab, name the project.
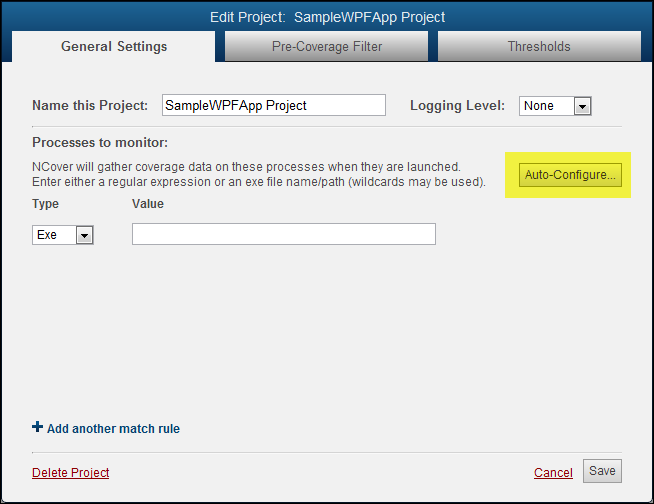
In the Processes to monitor: section, specify a Type and a Value to create a Match Rule for the IIS process.
You could use either Type of rule here -- an Exe ("CustMailer.exe") or a Regex ("CustMail*.").
3. Auto-Configure
Another option is to click on the Auto-Configure button and let NCover create match rules for you.

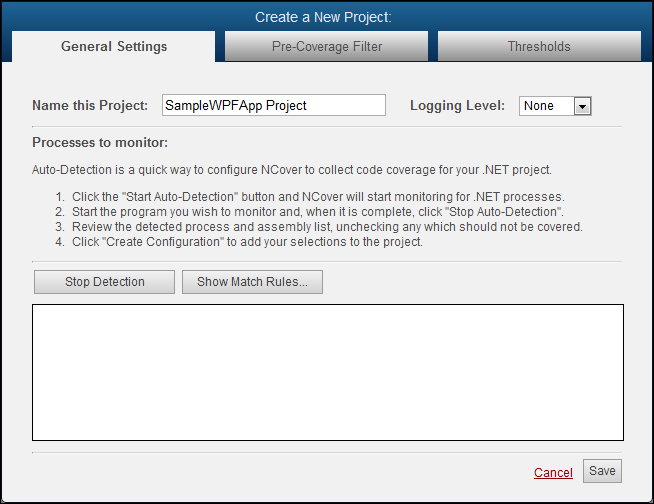
The General Settings tab will switch to the Auto-Detection view and start monitoring for .NET processes as soon as you click on Auto-Configure.

Start your application, and the executables and assemblies that are being loaded will display in the detection window.
Review the list and uncheck any items that shouldn't be covered.
Note that Desktop automatically excludes some common code, such as the Accessibility.dll
Click Stop Detection when your selections are complete, and Restart Detection, if necessary, to re-capture your processes/assemblies.
Click Show Match Rules to view the processes you selected.
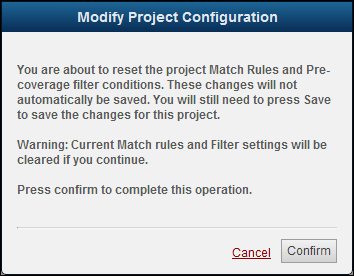
Note: If you have already saved project settings, a pop-up will alert you that confirming the configuration will reset the Match Rules and Pre-Coverage filter conditions, but these changes are not automatically saved. You will still need to press Save to commit the changes for this project.

Click Save to accept these selections, or Auto-Configure to start over.
Note: "Include" filters will be automatically created based on the detected modules that you selected. You can review the filters on the "Pre-Coverage Filter" tab.
4. Collect Coverage
When your project selections are complete, start or re-start IIS and run your manual or automated tests.
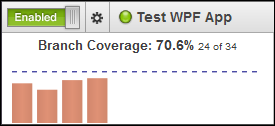
If you're viewing the Home page of the NCover Explorer from the NCover > View > Explorer View, you'll also see that the light beside your enabled project is pulsing green to indicate coverage is being collected.

In the lower right corner of the Visual Studio window, you'll see a pop-up when you're gathering coverage. The Modules Collecting counter displays the number of modules being profiled in the current execution of your project. The number will fluctuate while coverage is running, but the counter should eventually disappear when profiling is complete.

When your tests are complete, don't forget to stop or cycle the service to end profiling and allow NCover 4 to collect coverage data.
The Visual Studio plug-in makes the process of collecting code coverage simple, and then gives you access to dynamic and powerful views of coverage trends.