Analyzing Coverage Data
Then
The NCover Explorer provided a graphical way to examine coverage results from a tree view and a source code window. You could set project options, merge files and generate reports from the Explorer, as well.
Now
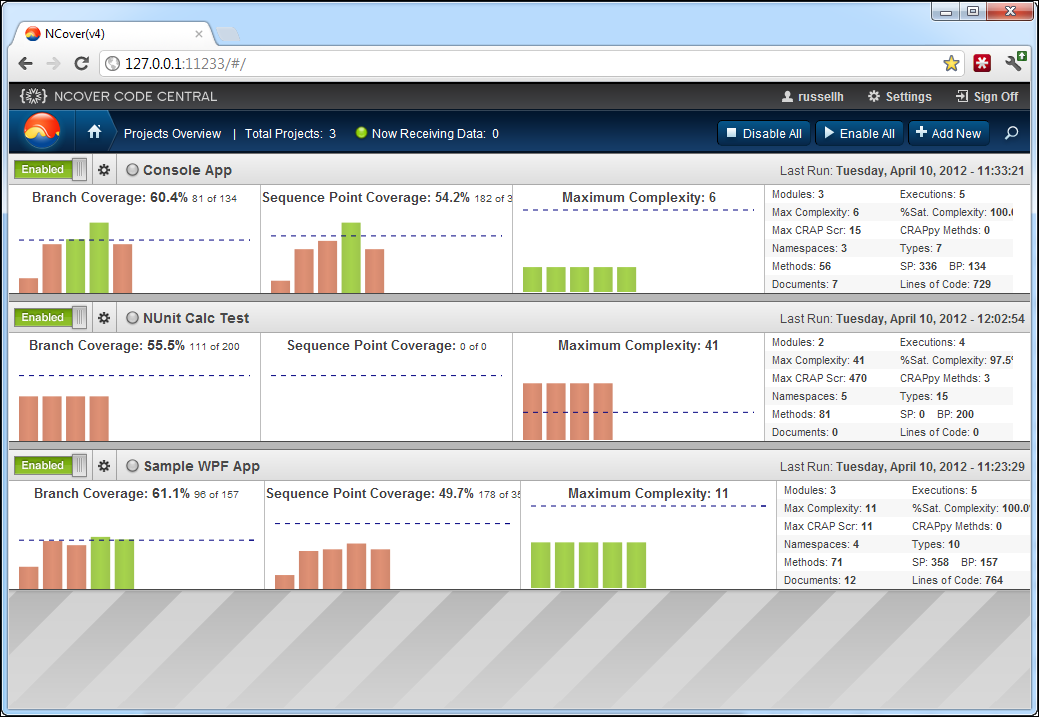
With Code Central, your coverage data is always in front of you. The Data Coverage View changes dynamically to display the data that's relevant to the level of code you're viewing.
The Home view summarizes all your projects, and the Coverage Data view changes as you drill-down to display statistics at each of six data levels: Execution, Module/Document, Namespace, Assembly, Method, and Source Code.
Once an execution is complete, clicking on the name of your project from the Code Central Home page will change to the Project View, with a slider-driven list of Statistics at the top, the Branch Coverage or last selected report in the Coverage Data View, and a list of completed Executions, their logs, and statistical summaries at the bottom, in the Coverage Navigator pane.
See the Navigation section of the migration guide for more information on how to view data in Code Central, and Understanding Statistics for some tips on making sense of the numbers.