Drilling Through Data
After selecting a Project on the Home page, click to display the Execution view.
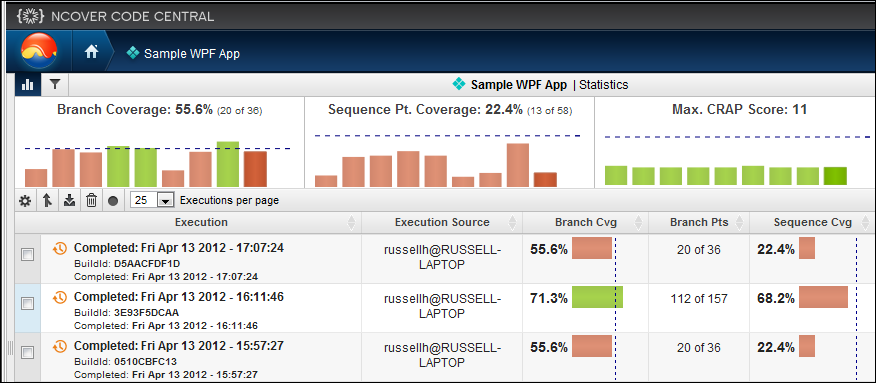
click on an Execution to drill down to the next view, which defaults to Modules, with Documents also available.
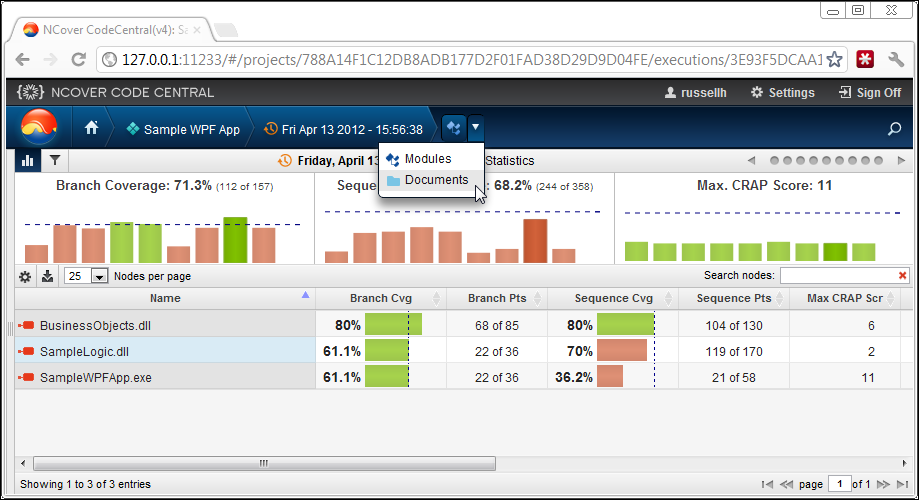
Click on a Module to continue drilling through Namespace, Assembly, and Method to arrive at the Source Code view, where Covered and Visit Counts are displayed in a pop-up when hovering, along with Branch Visualization and coverage highlighting.
In the lower right corner of the Source Code window, the coverage status is indicated by simple red or green text coloring of the word "Covered" in a pop-up window, activated by mousing over lines of code.
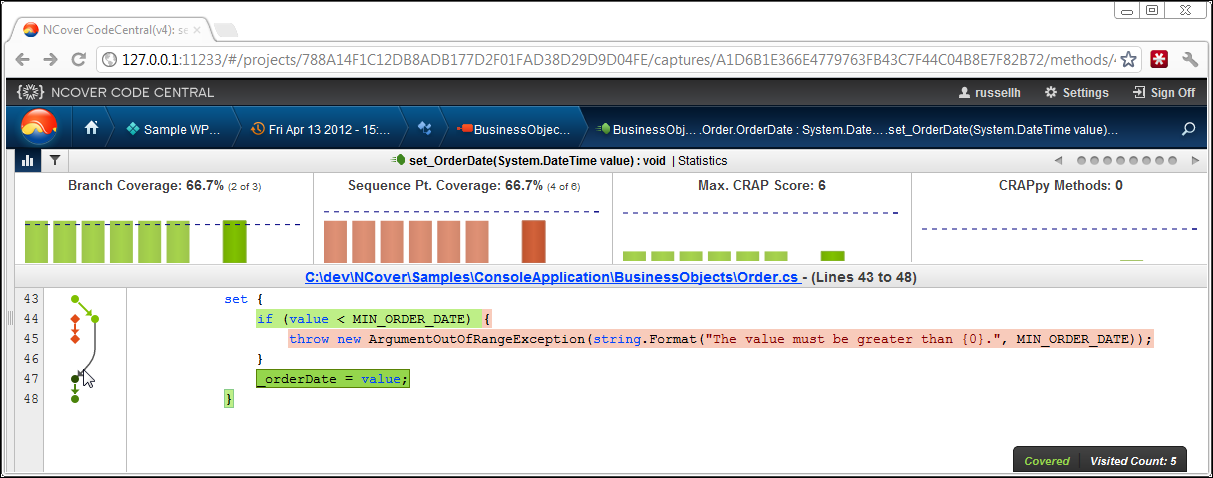
The number of Visit Counts is also displayed in this pop-up when hovering.
Branch Visualization, a graphical display of the possible paths through the highlighted code, is displayed to the left of the source code, and coverage highlighting appears on the code itself.
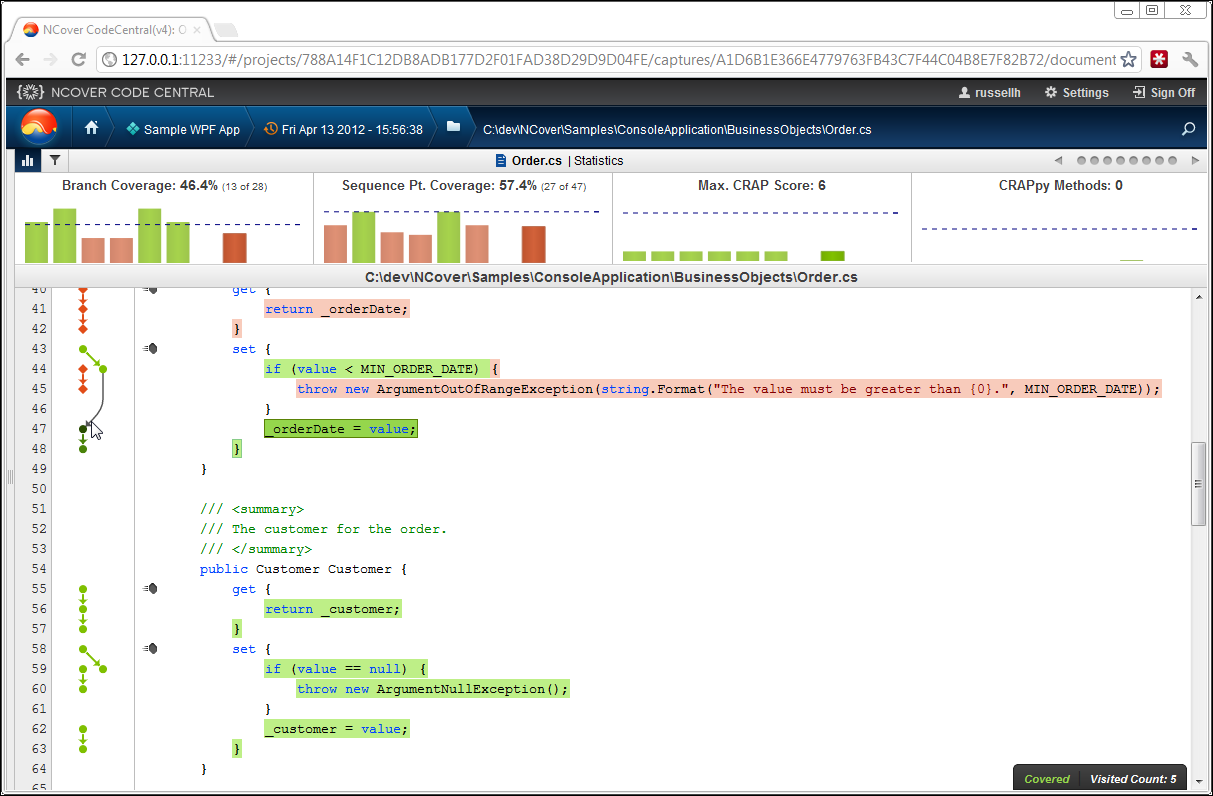
Clicking on the document link in the Source Code View will display the entire document, rather than the lines of code contained in the method you drilled-down on.
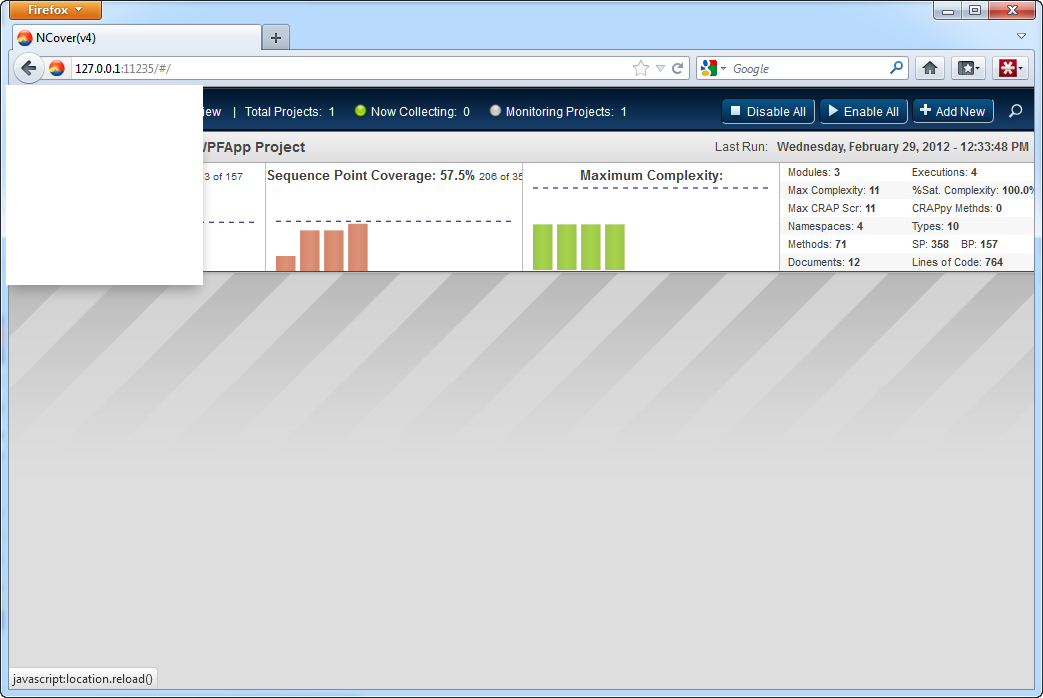
You can refresh your coverage data anytime from the drop-down menu below the NCover icon on the Home view.
Code Central will also alert you with a toast pop-up notification at the top of the Explorer window when new coverage data is available.
