NCover Visual Studio Extension How To Guide
The latest NCover Visual Studio extension is a multi-platform .NET profiler that offers built-in code coverage. Currently, the NCover Visual Studio extension can cover MSTest, NUnit, xUnit and TestDriven.Net tests.
The NCover Visual Studio extension can also profile your compiled application as you debug it in Visual Studio.
Install and Register the NCover Visual Studio Extension
- Install/update NCover Desktop
- Select the available Visual Studio extension plug-in check box(es) to include with the Desktop install.
- After Desktop is installed, open Visual Studio and confirm the NCover menu has been added to the Visual Studio main menu.
If you have an existing valid, licensed Desktop install, no further registration of the NCover Visual Studio extension should be necessary.
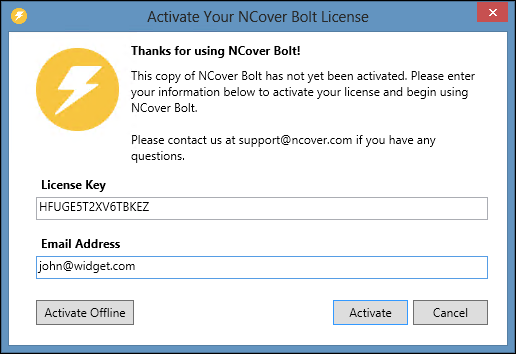
Reactivate or Relicense the NCover Visual Studio Extension
- From the VS NCover menu, select Licenses...
- Enter a valid email address.
- Enter the same valid NCover license key used to register the current install of Desktop.
One of the options within the Coverage Project sub-menu is the Default project option. The Default option will save all coverage information from a test run in the same directory that your solution is located in. This default data store is used when no NCover Desktop projects are assigned in the Bolt Coverage Project menu.
Connect to NCover Desktop
Bolt performs well as a test runner in Visual Studio and provides coverage metrics for the latest test run within Visual Studio. Linking your Bolt tests to Desktop provide an additional layer of functionality in the form of trend reporting across multiple executions of coverage and reporting features.
Bolt has access to all projects within Desktop. Bolt gives you the ability to select specific projects by clicking the NCover menu on the toolbar and selecting the desired project under the Coverage Project submenu. Selecting an existing Desktop project will display the coverage information from the most recent test run, if any is available.
After a Desktop project is selected, running a unit test using Bolt will automatically send coverage information to that project. When Bolt has run the tests and coverage collection is complete, the new coverage data will appear in Desktop automatically.
One of the options within the Coverage Project sub-menu is the Default project option. The Default option will save all coverage information from a test run in the same directory that your solution is located in. This default data store is used when no NCover Desktop projects are assigned in the Bolt Coverage Project menu.
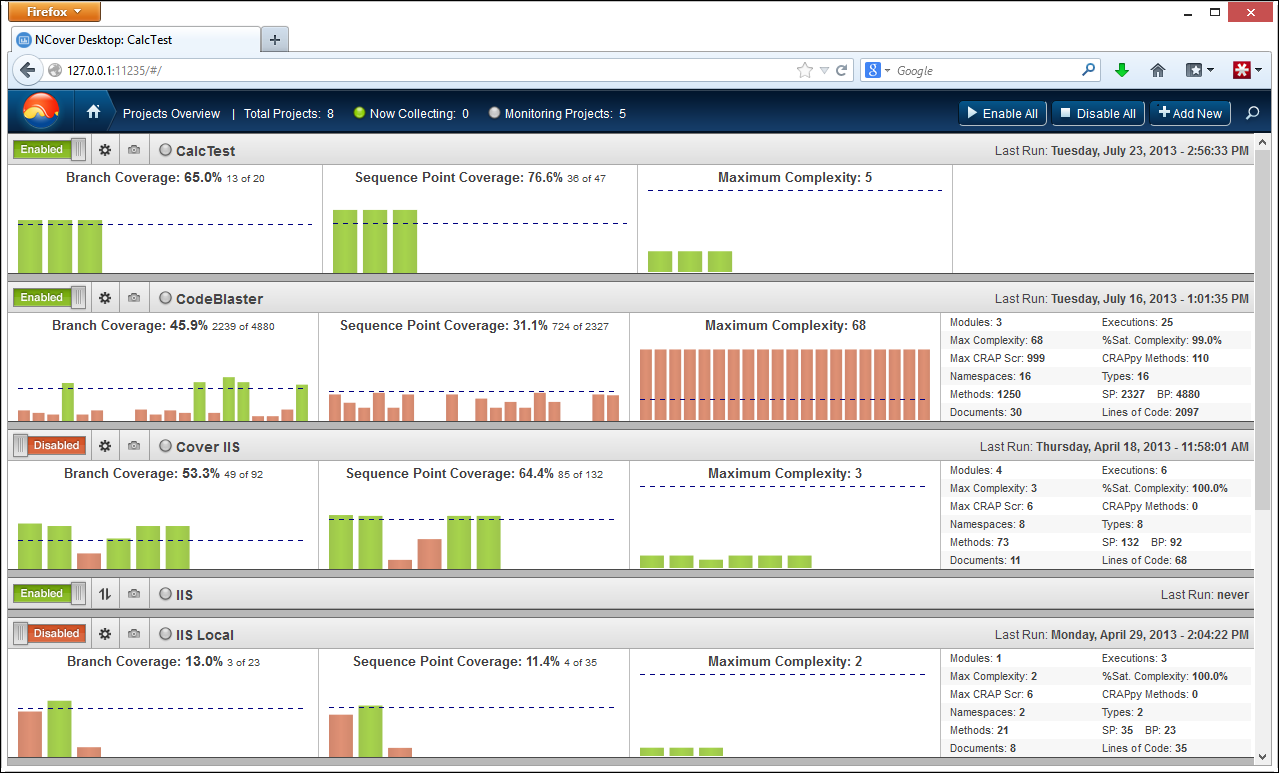
Open NCover Desktop from Visual Studio
From the NCover menu, select Open NCover Desktop.
The NCover Desktop application will open in your default HTML5 compatible browser.
View Coverage Results
To see the full range of coverage information the NCover Visual Studio extension provides, select the following three options under NCover menu:
- NCover > Enable Coverage
- NCover > Highlight Code
- NCover > Show Branch Coverage Visualization
Code Coverage Window
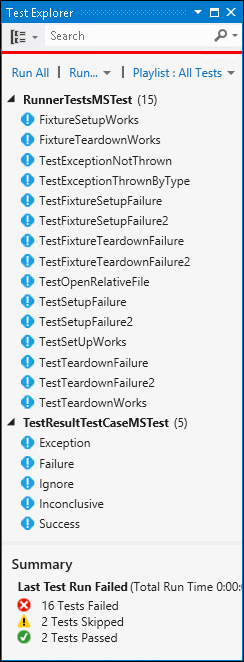
View coverage information and source code highlighting in the NCover Code Coverage window.
To access this window, click on the NCover menu from the VS top menu, select View > Code Coverage. A dockable window will display, containing Branch Coverage, Sequence Coverage, and several other metrics in a tree-view.
You can browse the tree-view and click to expand your covered modules, displaying the coverage numbers all the way down to the individual test.
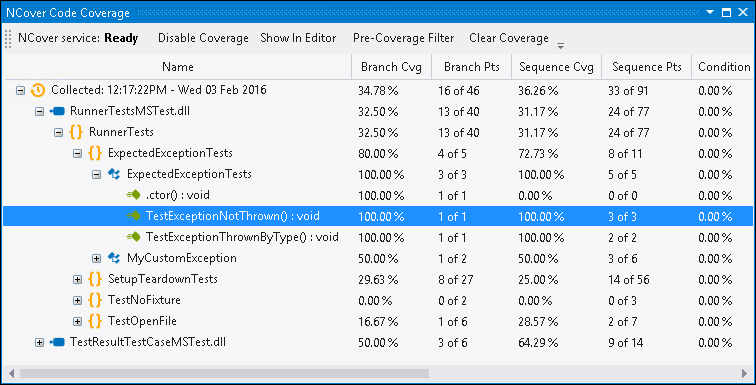
At the individual test level, click on 'Show in Editor' in the NCover Code Coverage menu to display source code.
Note: The NCover Code Coverage window displays coverage results for the most recent successful test run only.
The NCover Visual Studio extension saves data in the "Default" project (listed in the NCover > Coverage project submenu).
Code Highlighting
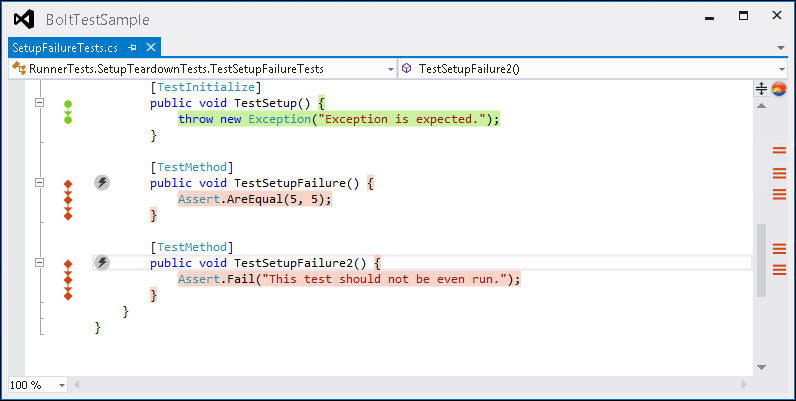
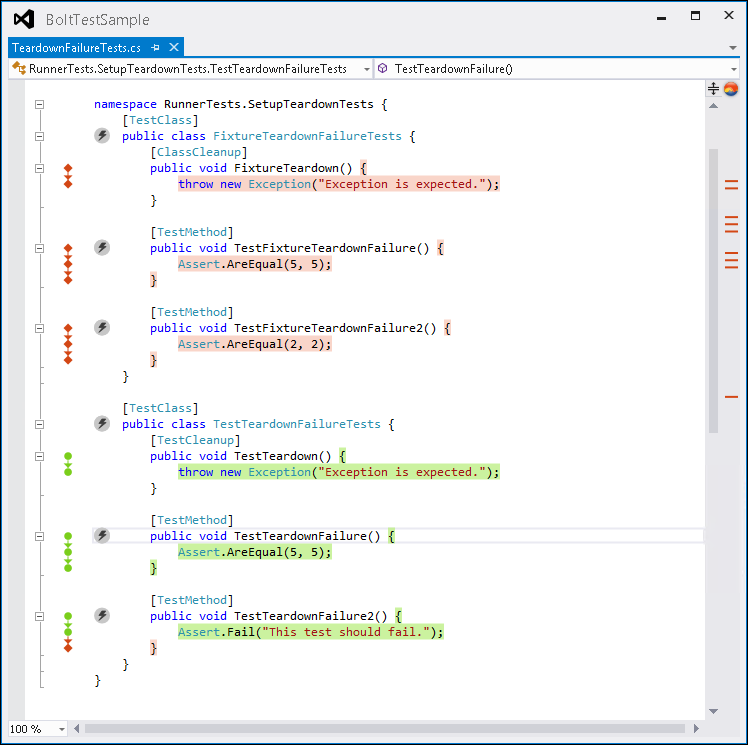
With Highlight Code enabled, the NCover Visual Studio extension can provide a simple, intuitive visual display of which lines of code were tested and which lines were missed.
Lines of code in red are untested, while lines highlighted in green were exercised by a unit test.
Branch Coverage Visualization
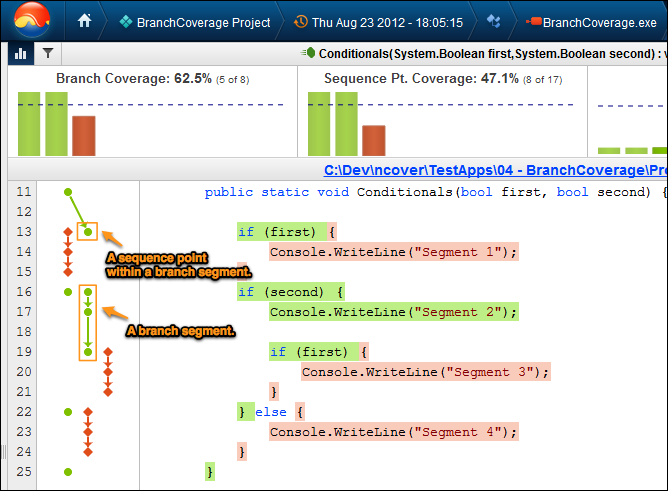
With Show Branch Coverage Visualization enabled, you can also see the NCover Visual Studio extension's branch coverage visualization for your source code.
This visualization represents how the code was executed; by hovering over each sequence, you can see each path of each independent code segment that was run.
A green dot represents a covered sequence point, and a red diamond represents an uncovered sequence point.
Pre-Coverage Filters
On the NCover Code Coverage sub-menu, click on Filters... to open the Pre-Coverage Filters window.
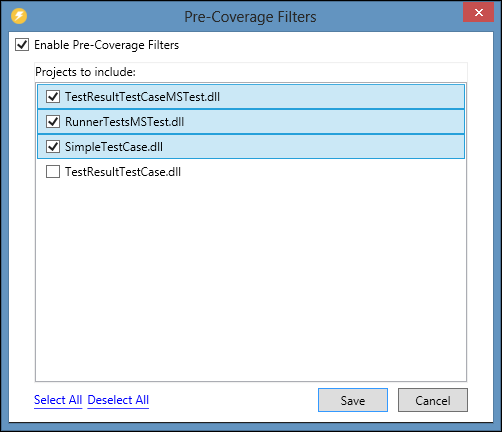
This menu allows the user to select which assemblies to be profiled from the projects defined in a solution.
You can click to disable the Pre-Coverage Filters. You can also Select or Deselect all available options.
View Unit Test Coverage
Visual Studio's Test Explorer and test adapters support automatic coverage collection for the following test runners: - MSTest - NUnit - xUnit - TestDriven.Net
Simply run tests from your preferred test runner, and the NCover Visual Studio extension will automatically profile your tested code.
View Application Coverage
The NCover Visual Studio extension offers integrated coverage collection for the following apps when they are launched/debugged in Visual Studio: - WinForms - WPF - Console Apps - ASP.NET web apps
NCover Visual Studio Extension Output Window
The NCover Visual Studio extension output window is available in the Visual Studio output window when tests are run.
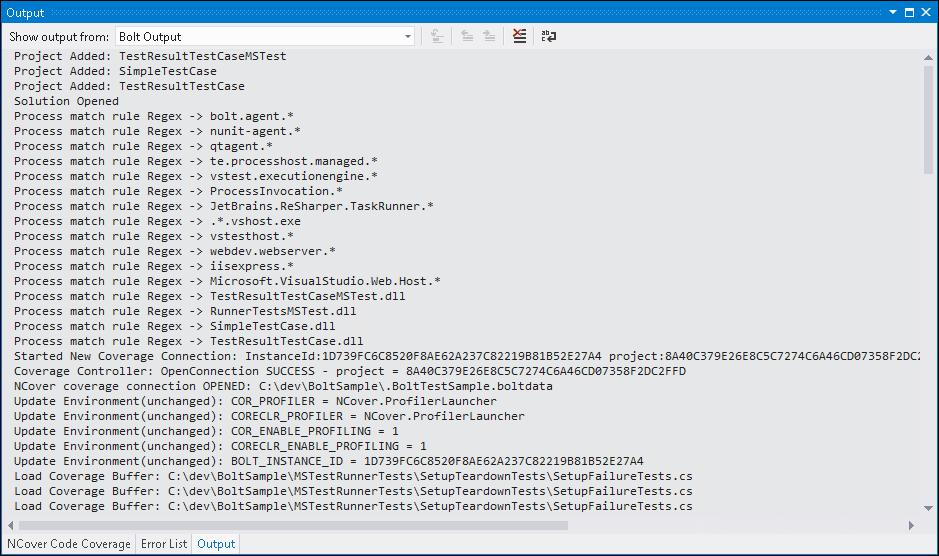
The output window is not automatically activated, but the output is made active within the window, if the user chooses to view it.
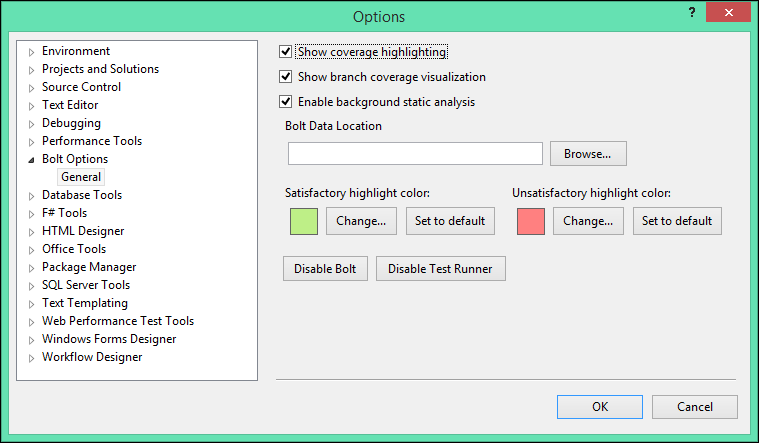
Change NCover Visual Studio Extension settings
From the VS NCover menu, select Options.
The Options window will display, which allows you to select/deselect the "Show coverage highlighting" and "Show branch coverage visualization" options.
You can also change the satisfactory/unsatisfactory highlight colors here.
NCover Visual Studio Extension Data Location
The Data Location field allows a user to select an alternate location for NCover Visual Studio extension data storage. This is a global setting for Visual Studio. The NCover Visual Studio extension's default behavior is to store all data locally in the solution folder under a uniquely named folder.
The Data Location field allows a user to place data for all solutions into a secondary location separated into subfolders by solution name. The user need only specify the containing folder, and then solution folders are created beneath that main location as needed.